For wind projects financed with tax equity, the tax equity investor is reluctant to take too much risk associated with the wind forecasts being incorrect. PAYGO structures have been created to deal with the risk of wind production. Different PAYGO structures can be created to mitigate the wind production risk and are related to the fact that much of the tax equity after tax cash flow comes from production tax credits. Production tax credits are direct reductions in taxes (as opposed to tax deductions that reduce taxable income). The amount of production tax credits depends on the production of electricity that in turn depends on whether the P50 estimate is correct.
In order to not lose the production tax credits, tax investors have developed PAYGO structures that limit the risk of the decline in wind production. One option is simply to change the distribution percentage and increase the distribution percentage if the P50 production is not maintained. The most important problem is this case is if the there is not enough cash flow to pay for the P50 production even if the distribution to tax investors is very high (remember that the distribution cannot be 100% as each investor must take a percent of the cash flow in order to continue qualifying as a partnership that is not a bare transfer of tax benefits and where the tax investor has a substantial economic interest.
If you are modelling a PAYGO structure, the first key idea is that you need to have production estimates in addition to the P50 case in your model. You can then model what happens to the tax investor when the P50 case is not maintained. For example you can model the P99 case and demonstrate how much the value to the tax investor is required for the tax investor to get back to the P50 case.
The mechanics of PAYGO could increase the proportion of cash distribution made by the tax investor if the P50 is not reached. This poses significant problems for the back leverage debt. If the P90 for example is reached, then the distribution to the sponsor would be reduced at any rate. This would lower the credit quality of the back leverage. Now, assume the cash flow distribution is lowered. This gives the back leverage a double penalty and increases the risk to the back leverage.
PAYGO and Earn Out
The mechanics of PAYGO can be similar to an “earn out” in acquisition transactions. Earn out transactions can occur then the buyer of a company does not pay the total price that is agreed for the company. But in earn out transactions the buyer of a company does not pay the full price immediately when the transaction is consummated. Instead, if the company earns its target EBITDA after a given period per the seller assumptions, more money will be invested by the buyer. You could call this a contingent deferred contribution. For wind projects and PAYGO, if the target P50 is reached this is like reaching the target EBITDA for the earn out. As with the acquisition, the full contingent investment will be made when the target is met. Before the project begins operation, the cash investment by the tax equity will be less. But if the P50 production is reached implying that the PTC target will also be generated, the full amount of the tax equity is invested.
PAYGO and P50/P90/P99
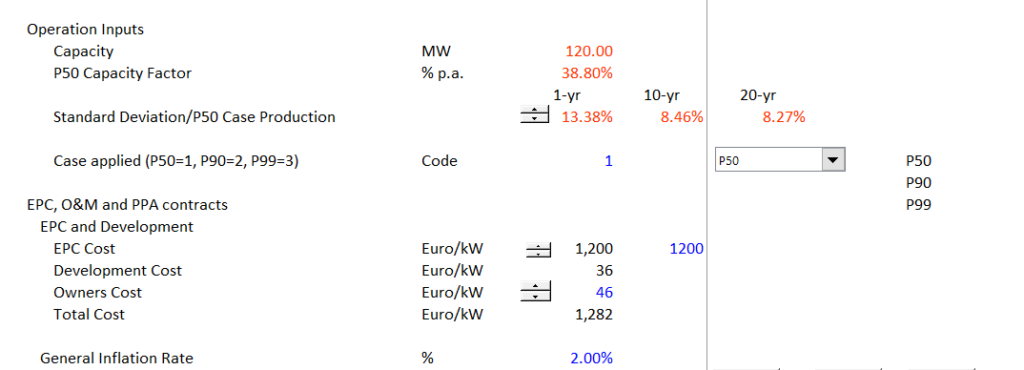
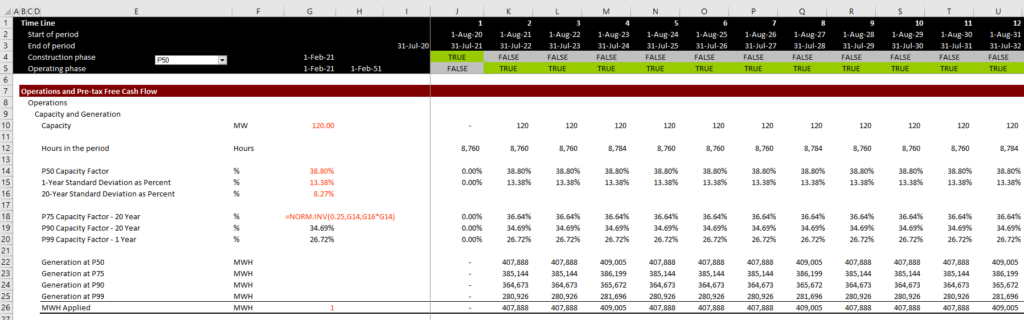
To introduce the PAYGO issue I begin with a little discussion of differences between the P50 case and other more pessimistic output cases that can affect the production tax credit. You can also go to my page on wind resource analysis that is linked to this sentence. On the screenshot below I have put in standard deviations of wind for different periods. In this case the standard deviation is 13.38%. You can use the NORMINV function to find the capacity factor at different probability levels. For example, if you want to find the P99 capacity factor in the example below, you would use NORMINV(.01,38.8%, 13.38%).
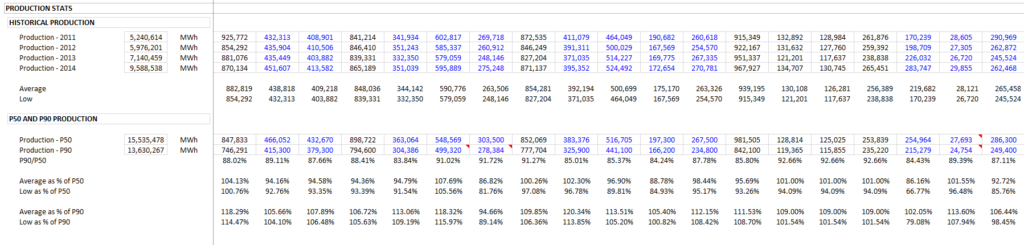
The next screenshot illustrates the difference between P50 and P90 from real cases. The example shows that most projects exceeded the P90 level but generally, the P50 generation is less than the actual production. This demonstrates that P90 is reasonable for a downside case. But be warned that these projects are in similar locations (around Texas and Oklahoma) with a good history of wind speeds.
.
.
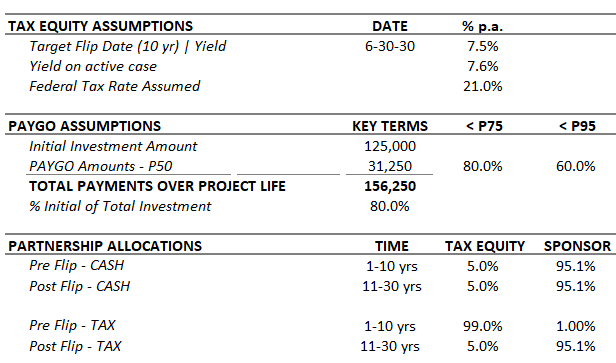
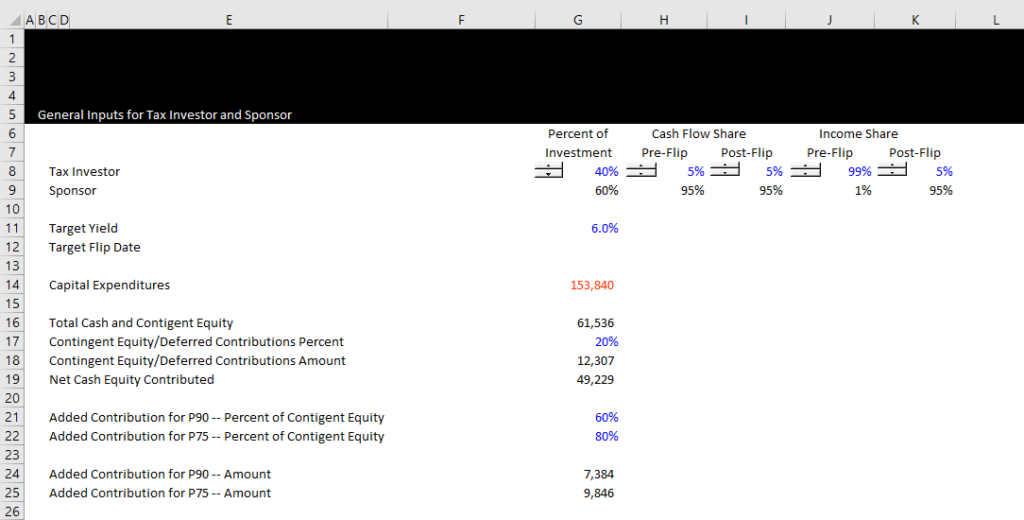
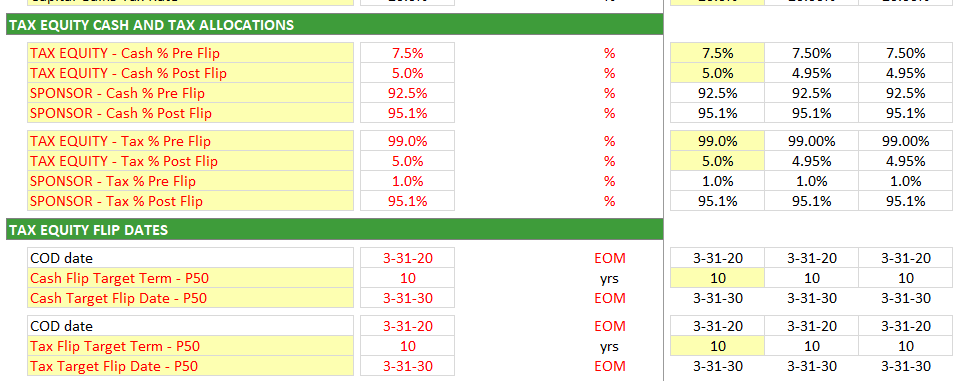
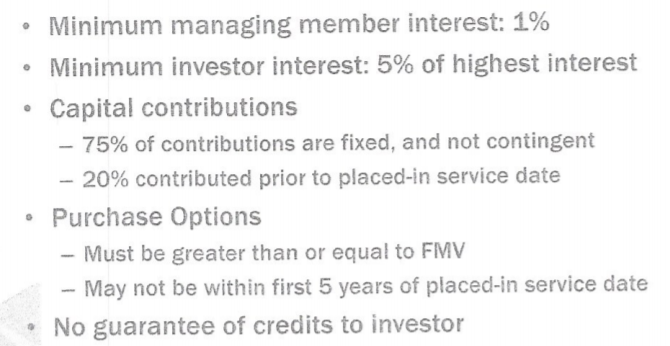
The mechanics of PAYGO with deferred contributions can be understood by looking at the assumptions in the screenshot below. Note target flip yield or the IRR hurdle is 7.5%. The PAYGO is illustrated in the second part of the table and shows that investment amount before the “earn out” or before the deferred contribution is 125,000. This is 80% of the investment that would be made if the P50 is obtained. If the P50 is achieved, the total contribution is 156,250. This 80% is a big deal. If the original investment is less than the total investment then the safe harbor terms are violated. The table shows that if the P75 level is achieved, then 80% of the 31,250 is invested. If only the P95 is achieved, then only 60% of the deferred investment of 31,250 is made. The table below also shows the distribution assumptions for the project which include only 5% of the cash flow before the flip while the tax distributions are 99%.
.
.
Once you have the investment that could be added to the project — in the above example it is 60% of 31,250 or 18,750 if the P95 is met (more than the P99). If the P75 is reached, then the added equity investment is 80% of 31,250 or 25,000. If the P50 is reached, then the full 31,250 is invested. This added investment accrues to the developer. As such the developer’s IRR is more sensitive to the production estimate. The manner in which the added investment is made involves some kind of gradual payment. The payment cannot be made all of a sudden in one day when it is windy and the amount of wind is more than the P50. The idea of making gradual payments is shown in the screenshot below.
.
.
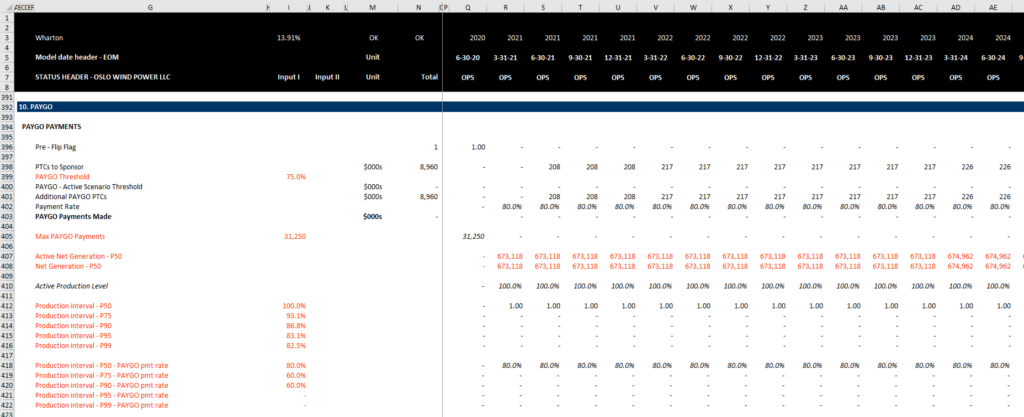
To illustrate how the PAYGO operates and the effects of the PAYGO on the IRR of the sponsor and the investor, I have made a relatively simple example of a wind project with different probability levels. The wind probability is from an actual project and the O&M layout is taken from a different model. Assumptions for the PAYGO are shown in the screenshot below. Note that the contingent equity must be less than 75% of the total equity. The 20% of contingent equity is therefore like a boat in a safe harbor. I also assume that if the P90 is met, the tax equity investor will put in 60% of his contribution. This may seem like a lot, but there is typically a big difference between the P99 one-year production and the P90 10-year production (again, you can look at the webpage for wind uncertainty to find this).
.
The screenshot below illustrates differences between P50, P75 20 year, P90 20-year and P99 – 1 Year. Note the dramatic change in production between the P90-20 year case and the P99-1 year case. It is the P99 1-year case that the tax equity would be most worried about and it is this case that would prompt no added contingent or deferred equity.
.
.
.
.
.
.