This page describes what I hope is an efficient way to structure a corporate financial model, meaning where to put various sections of the model; how to make the models transparent and how to make the model accurate. In addition to discussing where various sections of the model should be placed, key methods for auditing the model are described. Structuring the model is discussed using selected exercises and documented with associated video. You can download a completed version of the structured model by clicking on the button below or alternatively a version with blanks where you fill in the equations. If you are working through the exercises, I have left some of the important equations with a yellow background colour. You can find the structuring exercise on the page named HT Media Model Structure. I have also put a video that describes the structure of a model below the buttons that are attached to the model structuring files.
Excel File with Structured Corporate Model that has Completed Equations Through the Balance Sheet
[wonderplugin_video iframe=”https://www.youtube.com/watch?v=qZQQKIcasUM” videowidth=600 videoheight=400 keepaspectratio=1 videocss=”position:relative;display:block;background-color:#000;overflow:hidden;max-width:100%;margin:0 auto;” playbutton=”https://edbodmer.com/wp-content/plugins/wonderplugin-video-embed/engine/playvideo-64-64-0.png”]
Sections of a Corporate Model
In creating a financial model, you should start with history and not confound history with the forecast. The history should include the income statement and the balance sheet. The rest of the financial model should follow the Modigliani and Miller ideas of separating the company between core operations, free cash flow and financing cash flow.
- Historic Financial Statements
- Computation of ROIC and other key statistics to understand the company
- Assumptions Development
- Computation of Pre-tax Free Cash Flow — EBITDA, Capital Expenditures and Working Capital, Provisions
- Depreciation section with separation between existing assets and new assets and calculation of deferred taxes
- Calculation of after-tax free cash flow
- Addition of non-operating sections of the model — other income, other assets
- Financing balances including cash balance and debt balance and required minimum cash balances
- Financial statements – Profit and Loss, Cash Flow, Balance Sheet
- Financial Ratios
- Valuation
Financial Structuring Crimes that we have Committed
- Hard-coded numbers after assumptions in the model
- Not putting driving factors in the left column
- Putting the forecast of Profit and Loss and Balance Sheet at the beginning of the model
- No explicit debt and cash section that connects the financing with the balance sheet
- No historic switch and method to flexibly move from history to forecast
- Depreciation methods that do not recognize change in net deprecation rate with change in growth rates
- Formulas in the balance sheet rather than links to closing balance
- Meaningless colours that do not provide a guide
- No audit of balance sheet and history
- Polluting the fundamental models with multiple scenarios
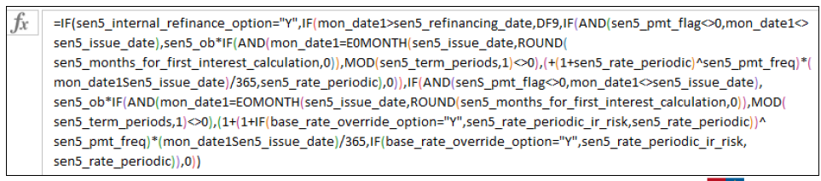
- Use of formulas that are too long
- Use of too many different excel functions (other than LOOKUP, INDEX and AVERAGEIF)
- Formulas that are not the same across the column
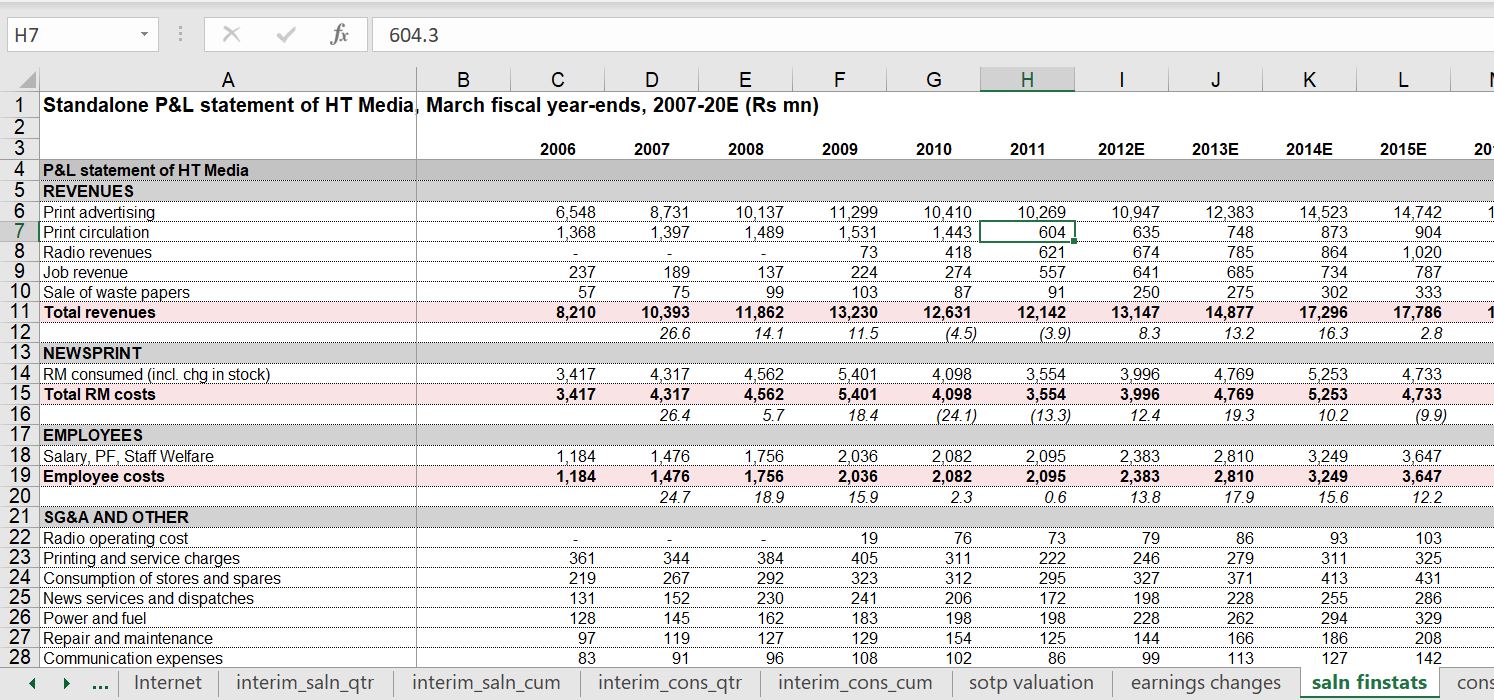
I have added some examples of bad modelling structure on this page. The example below shows the problem of starting with projecting the financial statements. Note there is a fixed value. You cannot see how the forecast numbers are derived. There needs to be a natural flow.
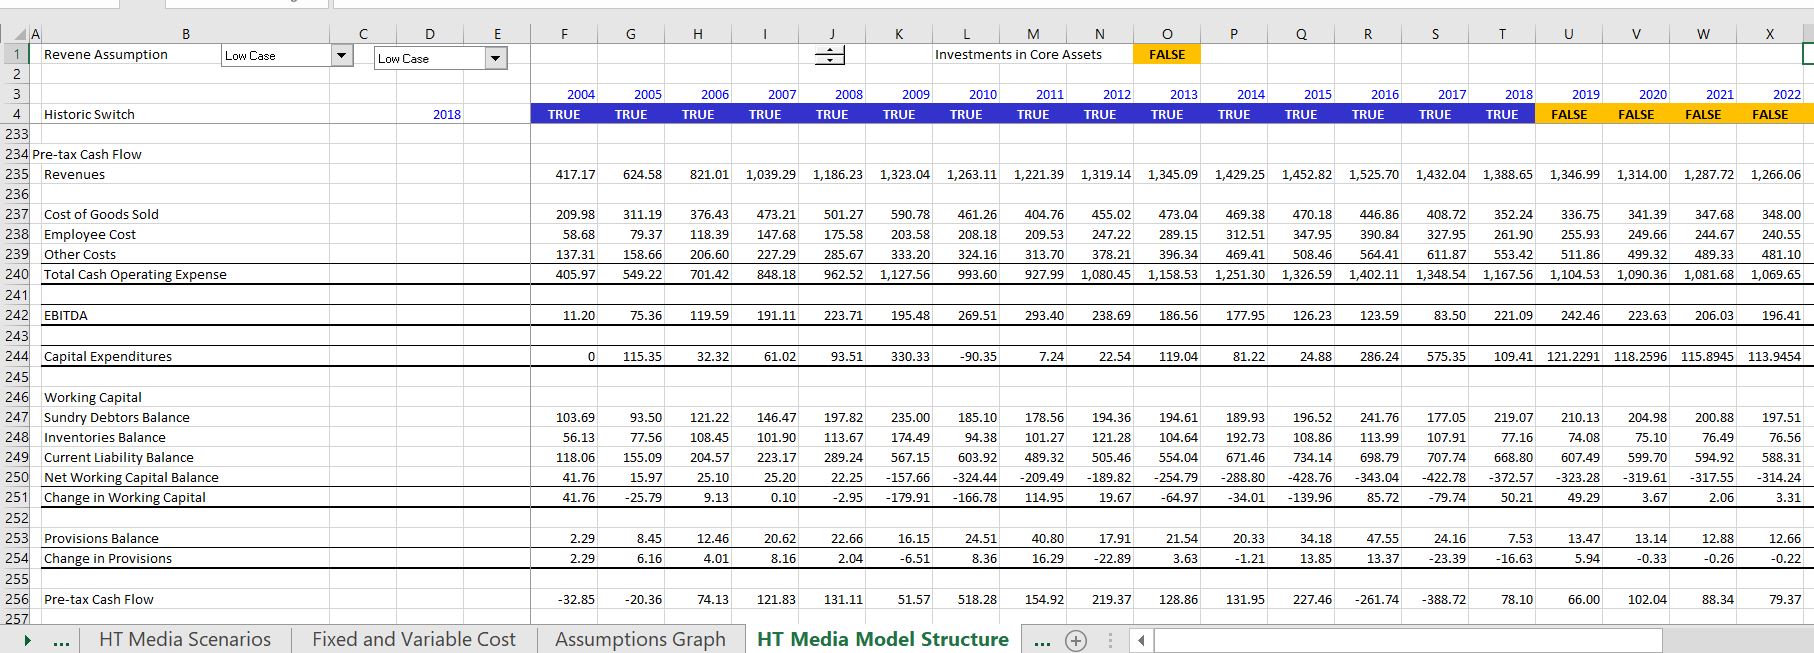
Pre-tax Cash Flow Section
Free cash flow used in the DCF model is EBITDA minus capital expenditures minus working capital changes plus changes in deferred tax related to operations and changes in provisions. It is also minus taxes. But you can start by computing pre-tax free cash flow and assess the cash flow relative to history. You can even compute return on investment -cash flow. This is the crucial section of the model. Could even compute the pre-tax ROIC. Most of the elements in this first section after the assumptions come from the assumptions section as shown in the screenshot below. You should compute the working capital balances and include potential write-offs of the inventories or the accounts receivable. I suggest also computing the balance of provisions in this part of the model.
Depreciation Section, After-tax Cash Flow and Other Income
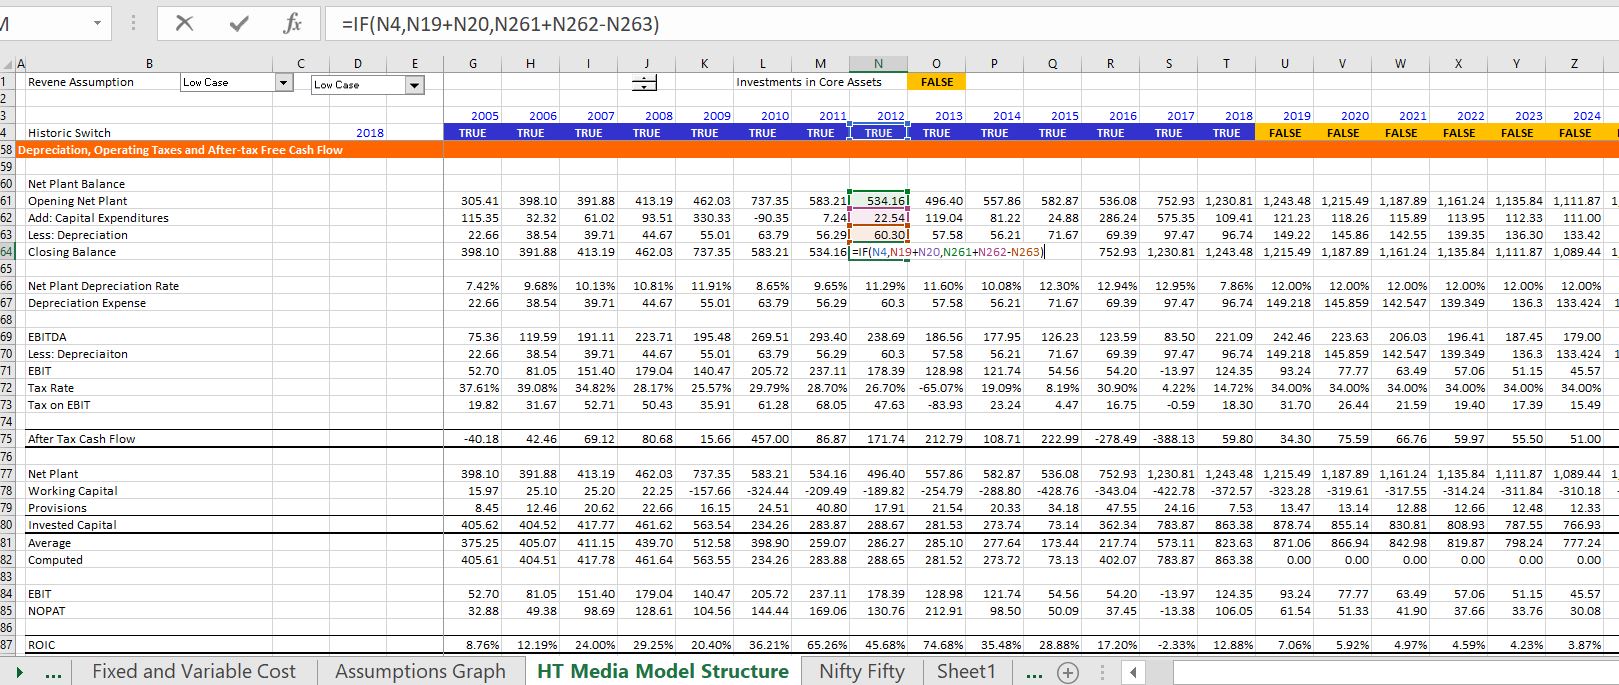
To compute depreciation and any other balances, you should use the historic switch and put in a flexible formula for the closing balances. You use the actual balances during history and then after the historic period, you compute the closing balances as the opening balances adjusted for changes. You can compute the depreciation using the net plant or the gross plant and the plant should be adjusted by the capital expenditures. In the screenshot below I use the net plant method to compute depreciation. But you can go into much more detail related to depreciation expense. Please refer to the depreciation section of the website for complications, retirements and other issues. Once you have After-tax cash flow should represent an all-equity financed company. There could be a tax carryforward even if there is no debt. With the after tax cash flow and the balances of working capital and the balance of provisions and the balance of net plant you can compute the invested capital using the direct method. Then you can go to your assumptions graph and evaluate you assumptions as compared to the resulting ROIC. Calculations of the net plant and the graph are shown on the screenshot below.
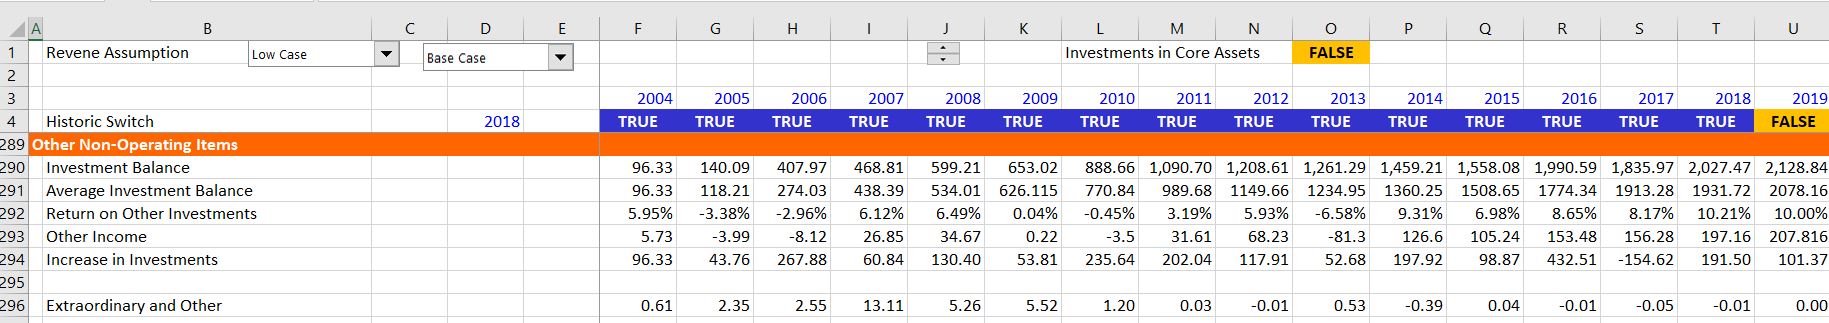
In the screenshot below I show how you should cover all of the balance sheet items in your model as well as the other income items. This case includes a large balance in other investments and the associated other income. Including all of these things in a separate section will make it a lot easier to balance your balance sheet.
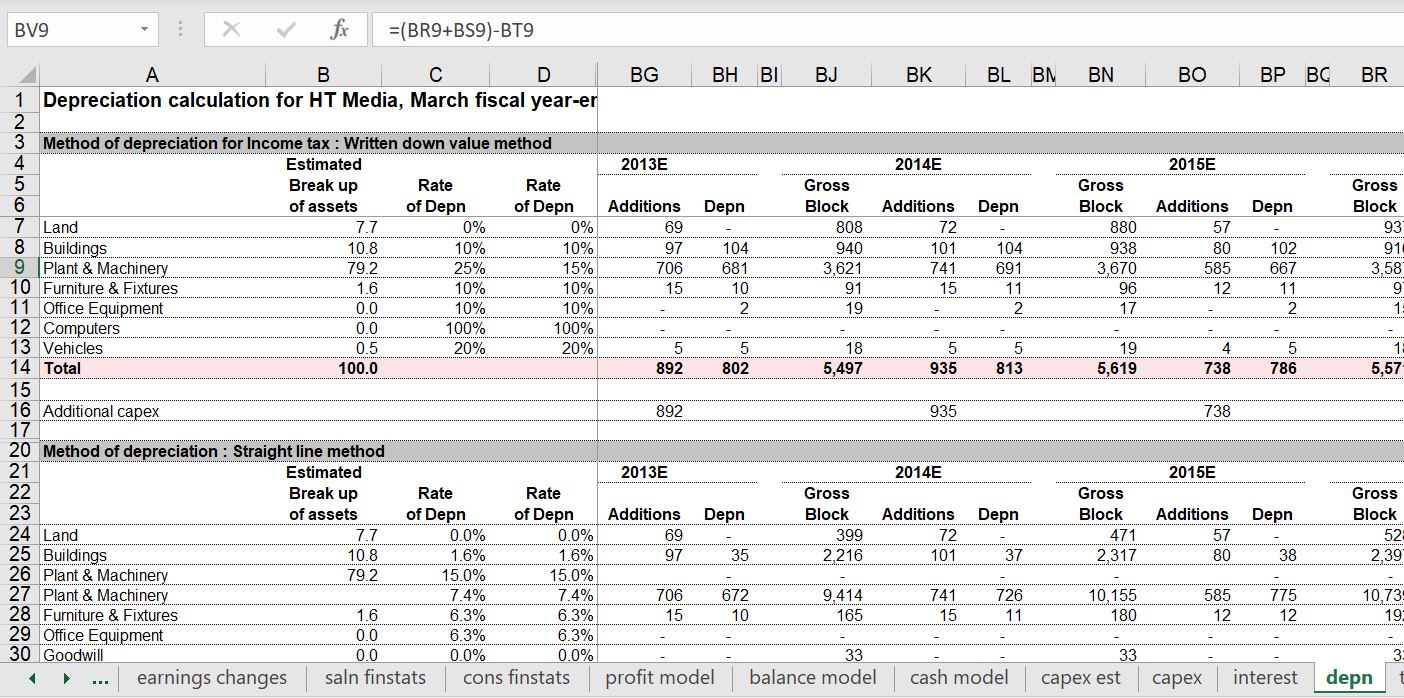
The screenshot below shows you what not to do in the case of depreciation. In this case the gross asset balance was used but no retirements where included. This results in a big over-statement of depreciation expense even though the model looks really fancy. You can go to the page associated with this link and listen to me ramble and rave about errors in modelling depreciation expense.
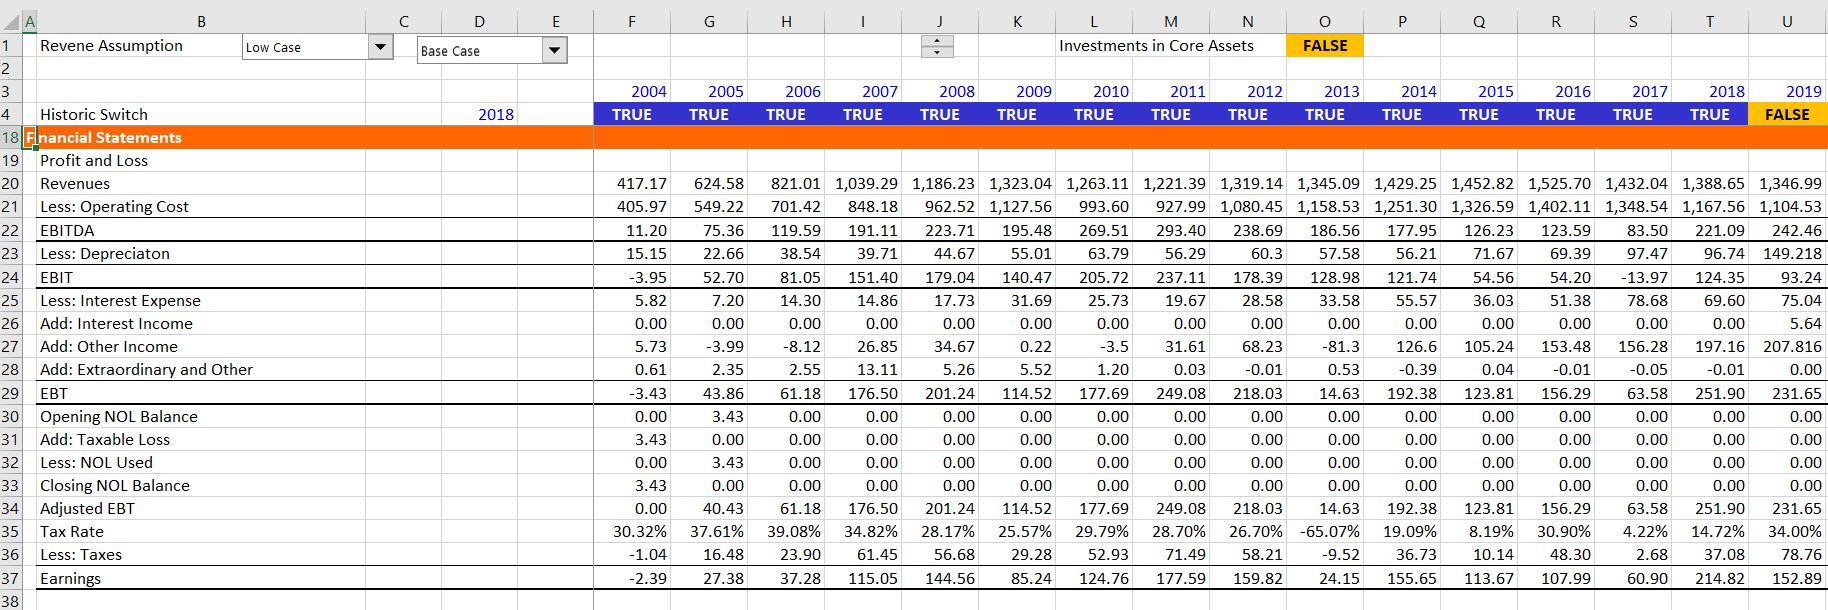
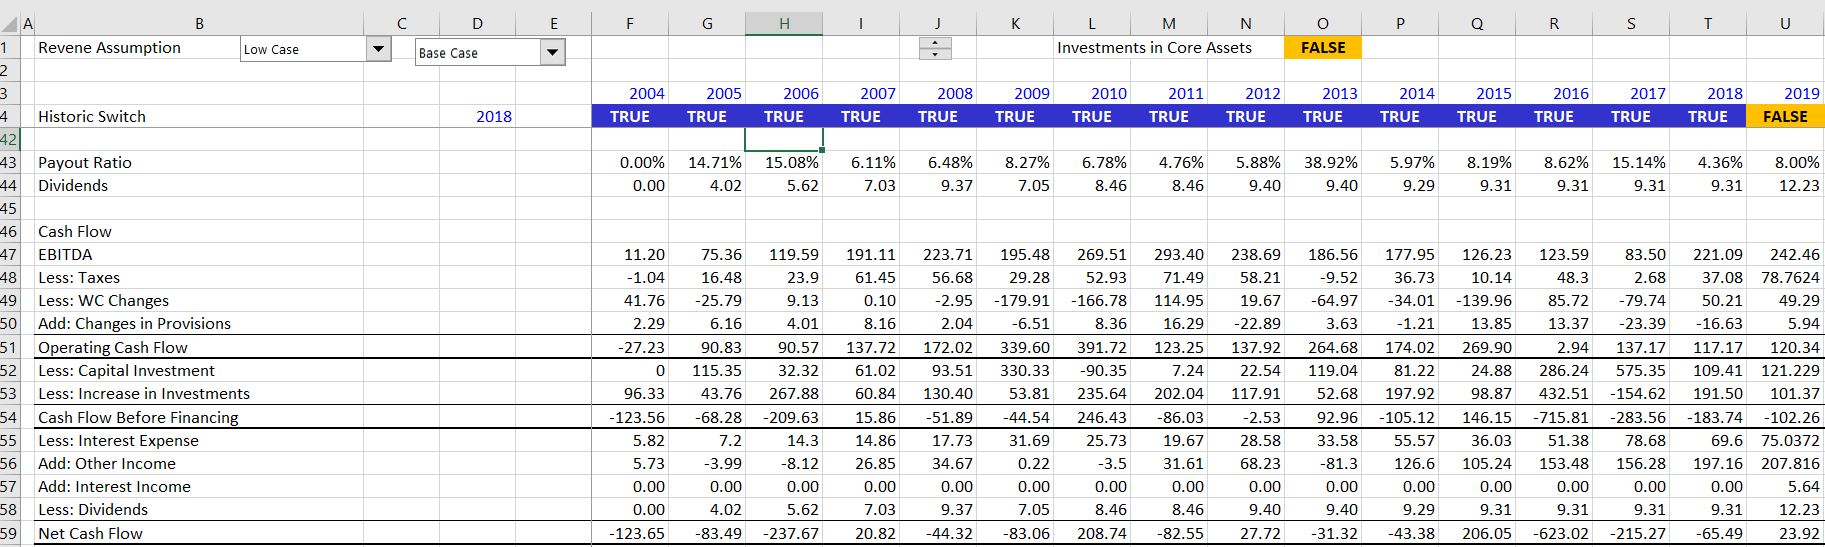
Financing Section with Minimum Cash Balance, New Debt Issues and Over-drafts
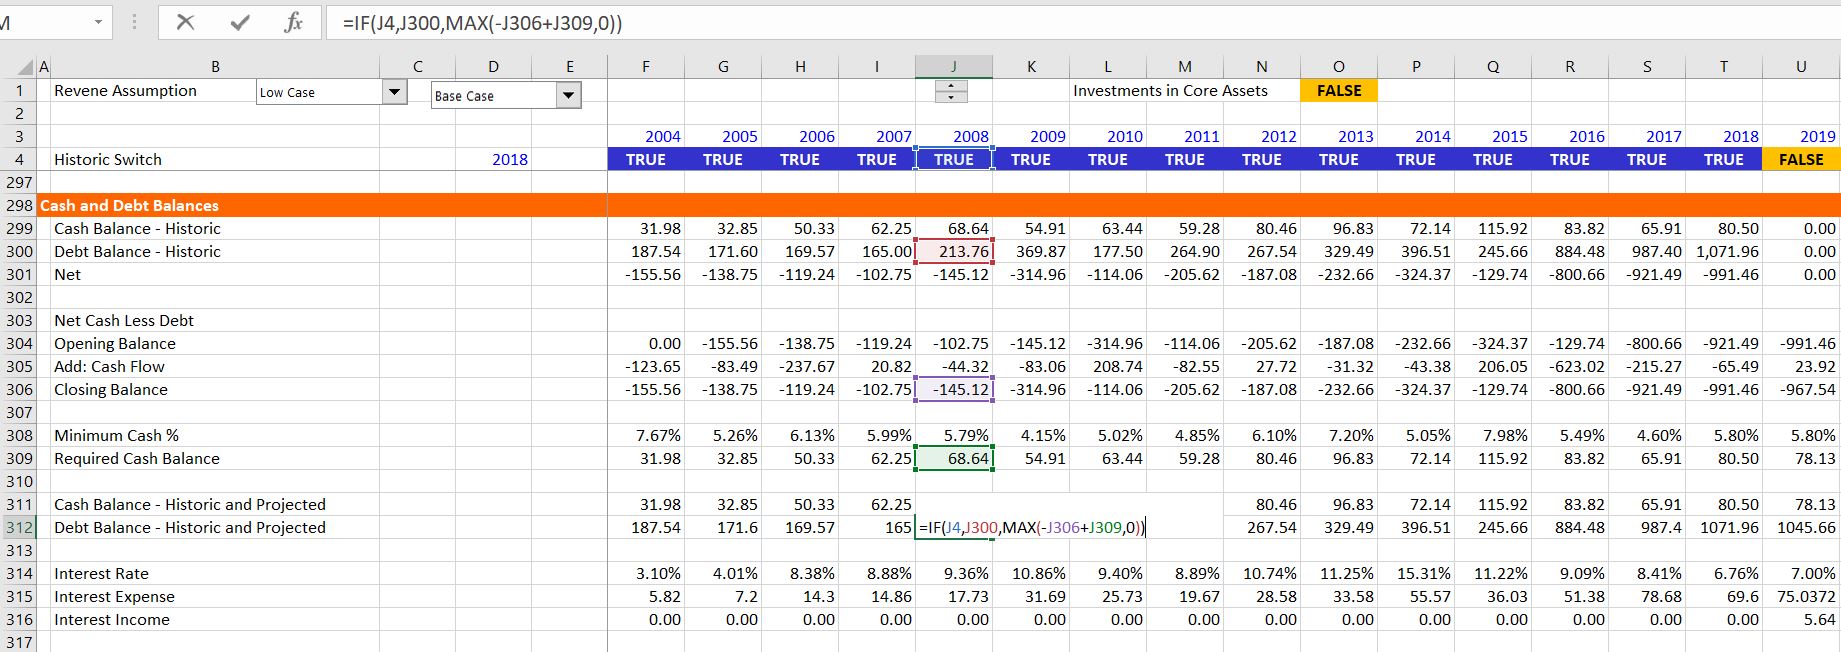
After you have evaluated the ROIC, you can begin the financing section of the model. I scream about keeping the operations separate from financing over and over again in all types of financial models. This financing section of the model where you put in the balances of cash and debt financing can be very simple or quite complex. Complexities involve putting in details of the debt structure with minimum cash balances and splitting up long-term debt from short-term debt and overdrafts. When you set-up this section and write the titles, you should also set-up the cash flow titles. The first screenshot below shows the set-up of cash and debt balances. To model the minimum cash balance you can use a function MAX(net cash and debt,minimum cash). Then to model the debt balance, if there is a minimum cash constraint, you must add the required debt financing to keep the cash on the balance sheet. You can do this with the formula for debt as: MAX(-net cash and debt+minimum cash,0). In the case below the minimum cash is computed as a percent of revenues. Note that in the net cash and debt balance the amount of addition to the account comes from the cash flow statement. That is why I have added the profit and loss and the cash flow statement as subsequent screenshots.
One of the complications can be the calculation of income taxes with a net operating loss carryforward. This is quite easy unless you have a limit on the time of the NOL. Without the limit, just set-up a balance and use an MIN and MAX function. After putting in the opening balance, understand that the balance goes up when the EBT is negative. The NOL goes down when the EBT is positive and when there is an opening balance in the NOL balance. To model the NOL going up use MAX(-EBT,0). To model the reductions in NOL, use the MIN(opening balance, MAX(EBT,0).
Most of the work until you get to the bottom of the cash flow is simply collecting data from stuff you have already computed.
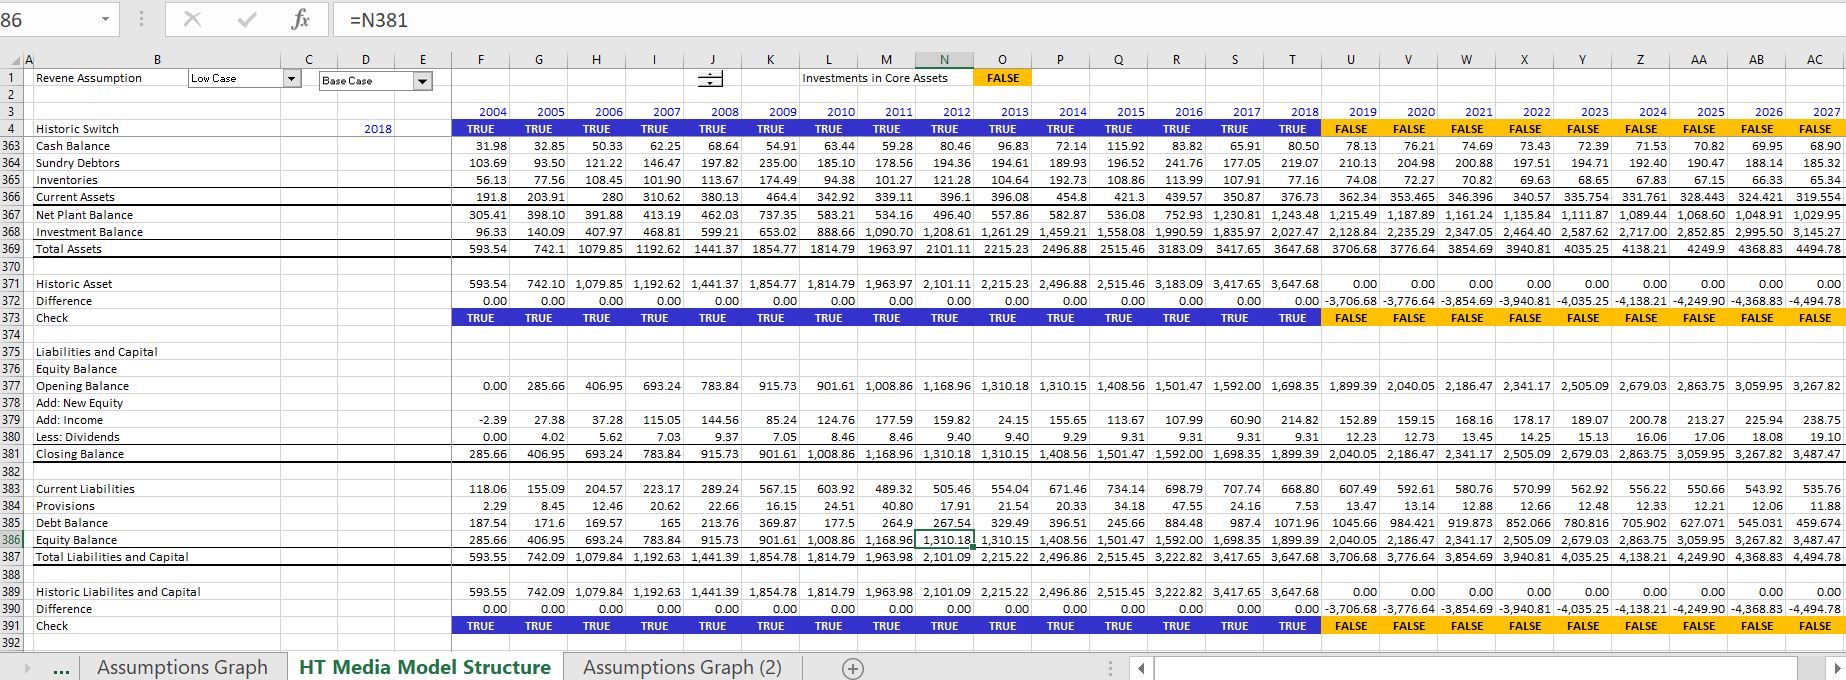
Balancing the Balance Sheet
The final step in structuring the model is to create the balance sheet. First write down the balance sheet titles which you should be familiar with — remember things like provisions and investments. Then you should find all of the balances somewhere in your model. That is, all of the accounts with one important exception. The exception is the common equity balance which is shown in the screenshot below. As with other accounts, for this account you should use the historic switch for the closing balance and allow the closing balance to smoothly transition after the historic period. You should check the balance sheet early before putting in too many complications. I have shown checks of the the asset history and the liability history. The ultimate check which I did not have room for on the screenshot is the check of assets and liabilities for the entire period.
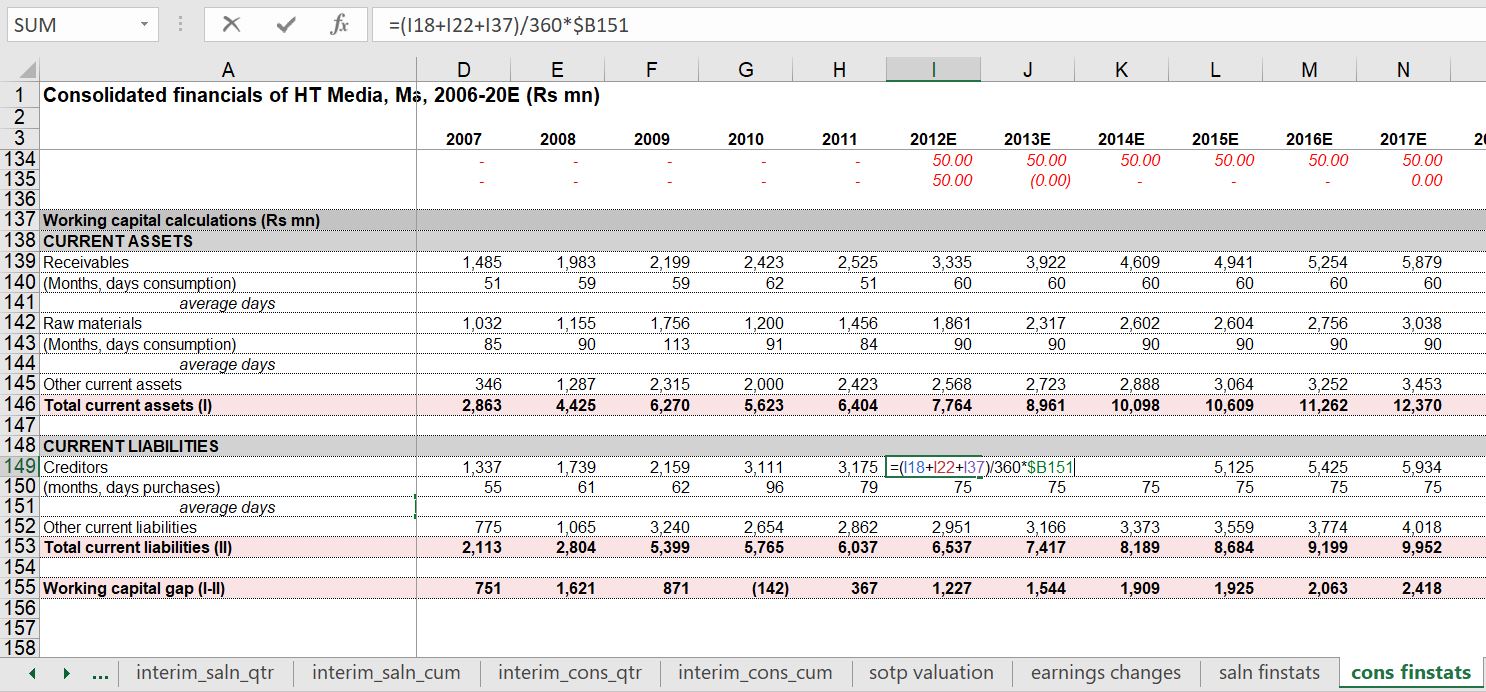
The screenshot below illustrates what you should not do with the balance sheet. I have hilighted a cell with a computation; and there are many. There is no historic switch and the connections between history and forecast are messy ….
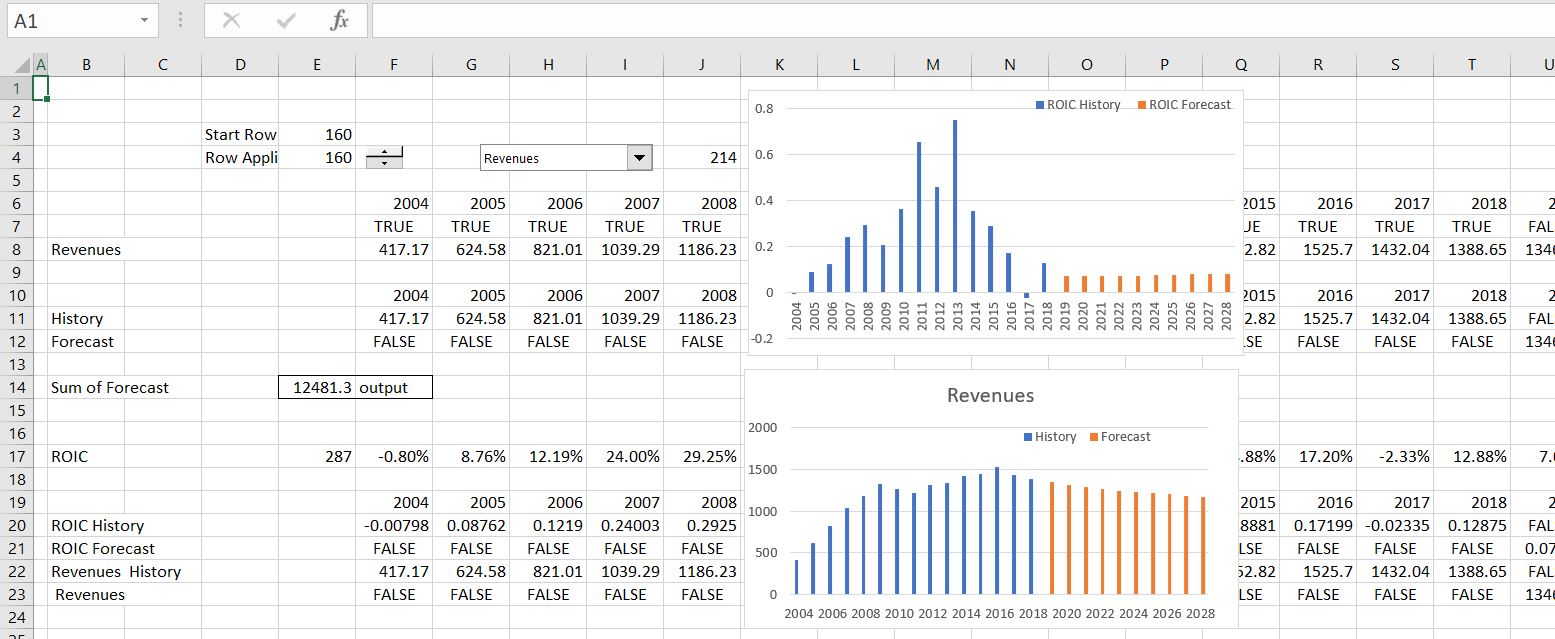
Presenting Assumptions and ROIC in Graphs
After you have structured the model, you can compare the various assumptions with the historic and projected return on invested capital. You can evaluate the returns versus history and try to understand what happened to bring down the return on invested capital.