This webpage discusses the theory and the practice of computing and interpreting the return on invested capital. The essential definition of return involves measuring the rate of return earned on core operations of the company rather than some vague formula that you should calculate using a specific definition. The discussion below uses a case where there is some ambiguity as to how to treat a large balance of investments and requires some judgement as to whether or not these investments should be treated as core operations. Sometimes the ambiguity in computing this return on invested capital statistic when you want to focus on operations can be resolved from the notes of financial statements to determine both what should be in the numerator of the calculation and what should be in the denominator of the calculation. To illustrate this I present some case studies on this web page. The files associated with the webpages are available for download below by clicking on the buttons. The last file in the series includes some blanks that you can work through yourself to assure that you have a good understanding of the concepts. The other files attached to the buttons have completed calculations. I have also included the read pdf to excel tool that is used in the some of the exercises. A long video that works through this initial part of a model is included below the buttons for download.
[wonderplugin_video iframe=”https://www.youtube.com/watch?v=-1KXpfObH9g&t=196s” videowidth=600 videoheight=400 keepaspectratio=1 videocss=”position:relative;display:block;background-color:#000;overflow:hidden;max-width:100%;margin:0 auto;” playbutton=”http://edbodmer.com/wp-content/plugins/wonderplugin-video-embed/engine/playvideo-64-64-0.png”]
ROIC and the Value Driver Formula
- ROIC = NOPAT/Invested Capital
- ROE = Earnings/Equity Capital
- Formula: Equity Value = EPS x (1-g/ROE)/(k-g)
- Formula: Enterprise Value = NOPAT x (1-g/ROIC)/(WACC-g)
- Formula: Enterprise Value = ROIC1 x Invested Capital x (1-g/ROIC2)/(WACC-g)
- McKinsey Discussion of the Formula:
This formula underpins the discounted-cash-flow (DCF) approach to valuation, and a variant of the equation lies behind the economic-profit approach (i.e. monopoly profit)….You might go so far as to say that this formula represents all there is to valuation. Everything else is mere detail.”
Theory of Using ROIC and Why Not to Use the ROE in Evaluating Financial Statements or Assessing Financial Models
In using a financial model to compute value, the ultimate issues is whether the company being valued is making good investments and growing. You want to know about whether the core fundamentals of the company are good — are its products selling well, are its factories operating efficiently etc. If a company is earning a lot of money because it bought stock in another company or because interest rates have fallen, this does not tell you anything about the core operations. In fact, for things like debt and other investments, you can easily make valuations from the market. If the company earns a little or a lot more than its cost of capital on its core operations, the company should grow and it should have a relatively high value. When you boil things down, the financial model is about forecasting returns and growth and assessing risk. When applying the value principles, the difference between the ROE and ROIC is not trivial and related to some kind of financial theory. ROIC should do something crucial, and that is to measure the returns from the core business of the company. That is, without pollution of the effects of things like having a whole bunch of cash on the balance sheet or investments in other associated or non-associated companies or making money from changes in the value of derivatives and other financial instruments.
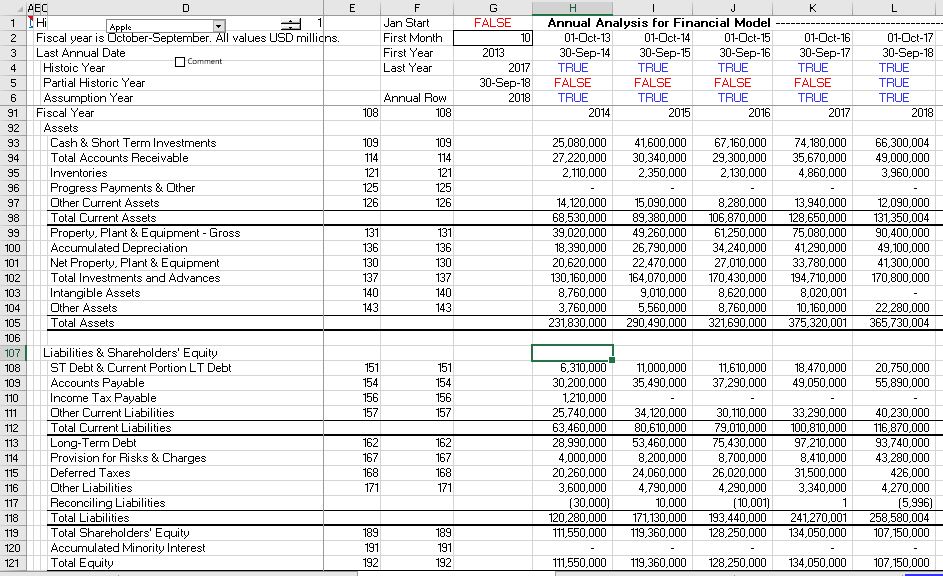
Being careful with calculation of return on invested capital is illustrated using the case of Apple. Apple has billions of cash on its balance sheet as shown below (66 billion — this comes from the financial database). But when you look at the balance sheet more carefully, you can see that the long-term investments are even larger — 170 billion. This is also financial investments that has nothing to do with selling i-phones or mac’s. So the real amount of cash — 246 billion is much more. Then when you look at the capital structure you can see that the amount of debt and equity (93 billion plus 108 billion) is less than the total amount of cash. These means there is no invested capital financing the rest of its assets.
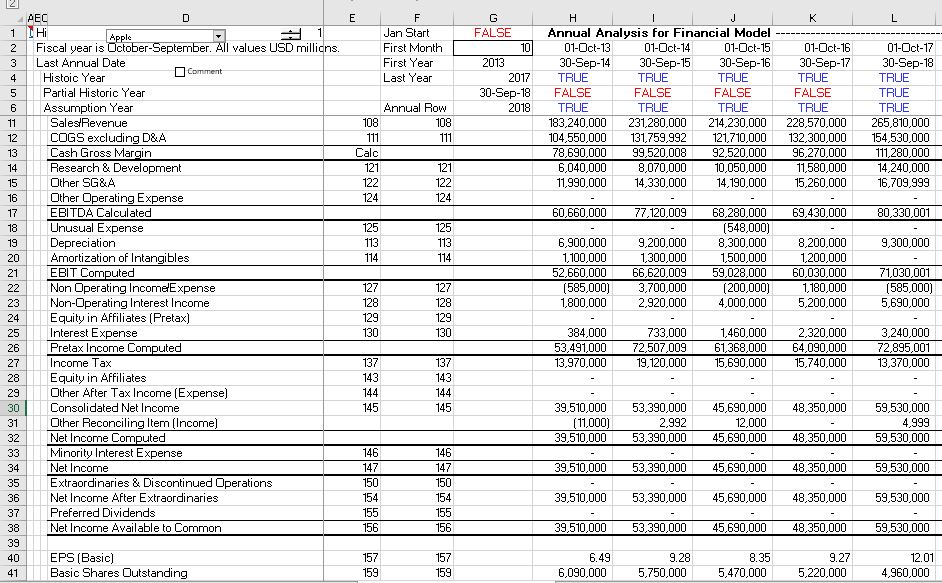
In computing ROIC, you should focus on the operations and compute the NOPAT. The NOPAT is the EBIT less tax that would be paid on EBIT. But you must make sure that the EBIT is not polluted by anything related to financing or other assets. You can see in the income statement for Apple below that the EBIT is 73 billion. You can take away taxes from this and arrive at the NOPAT.
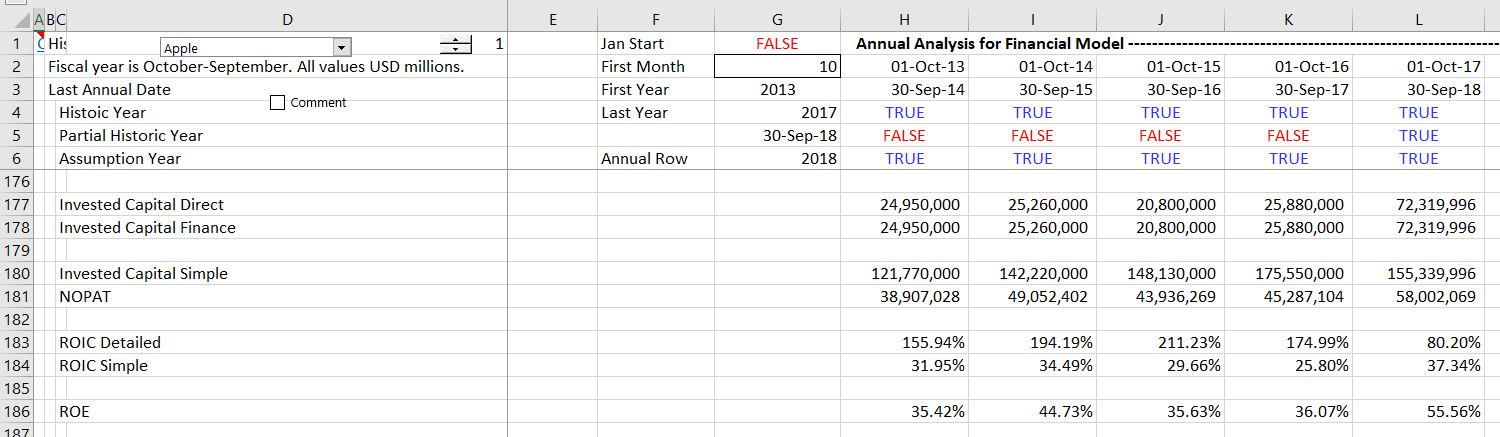
Computation of the ROIC for Apple is shown in the screenshot below. This depends on how you classify other liabilites. When other liabilities are classified as financing (see the method of 1’s and -1’s using the SUMPRODUCT method below), the invested capital and the NOPAT is shown in the screenshot below. The ROE means nothing and the only real issue with such a high return is whether the company can keep growing.
If you want the file that downloads all of the Apple stuff and can download much more, I have attached the file to the button below. This may be a good file to use because it only has one company and does not take a long time to download.
Review of Selected Excel Functions and Stock Price Analysis to Get Ready for Financial Analysis
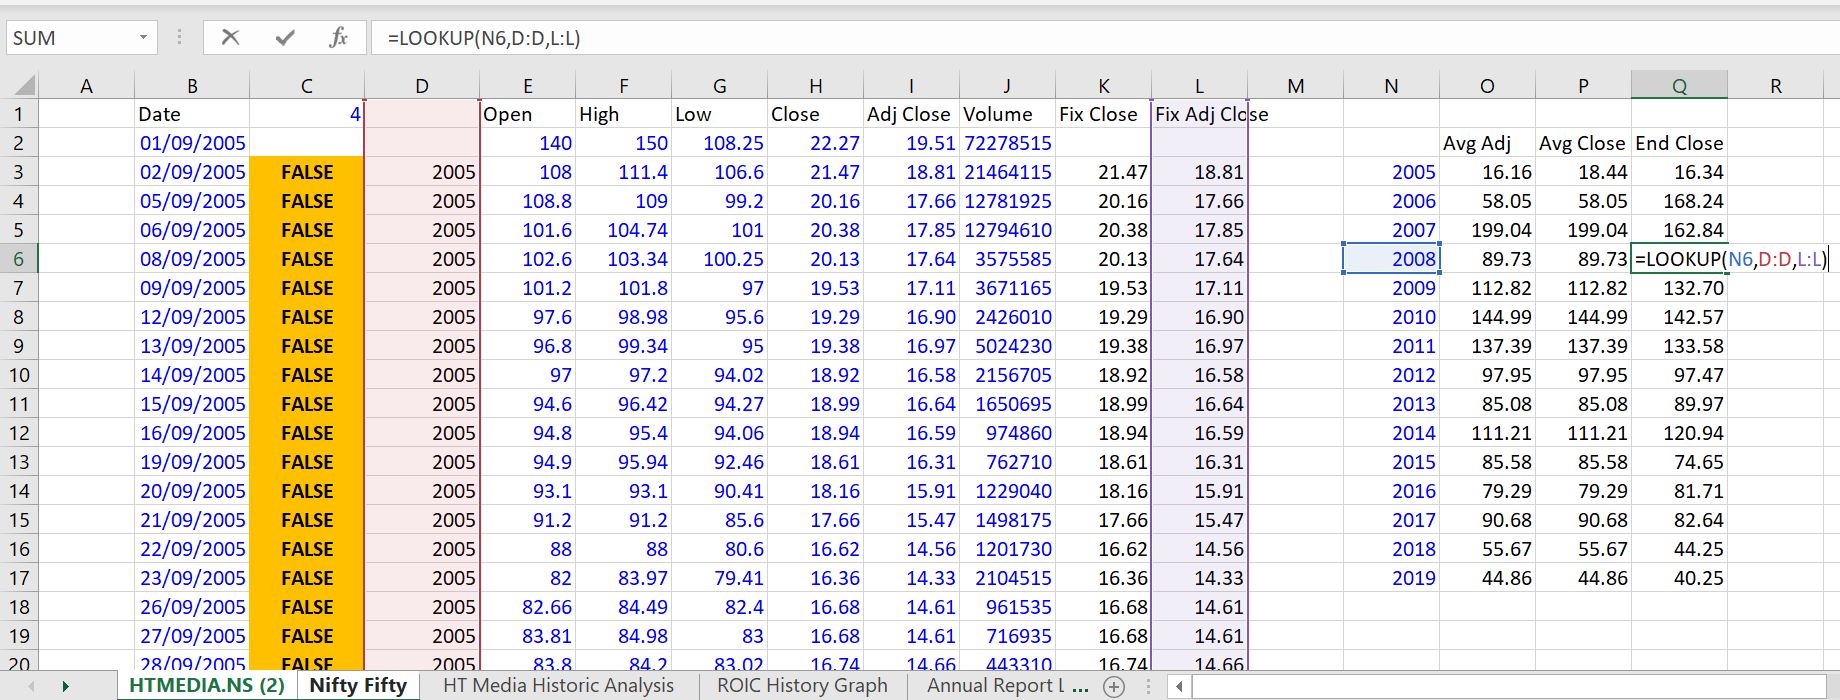
In developing this webpage I begin by reviewing some excel functions and discuss the idea of being good at a few functions and using the entire rows or columns. I discuss this in the context of a case study that will be used for the corporate structuring videos. I have copied a stock price page into the exercise page and you can practice working with three functions. The first is the AVERAGEIF function where you compute the average stock prices for the year. You can use the EIS short-cut to make a series of years and then you just refer to the year column and click on entire rows. I hope you can do this in a couple of seconds. You can do something very similar to get the closing stock price for the year. This can be done with the LOOKUP function that should forever replace the VLOOKUP or the HLOOKUP functions in your analysis (at least when you have time series). The LOOKUP function using entire columns is demonstrated in the screenshot below.
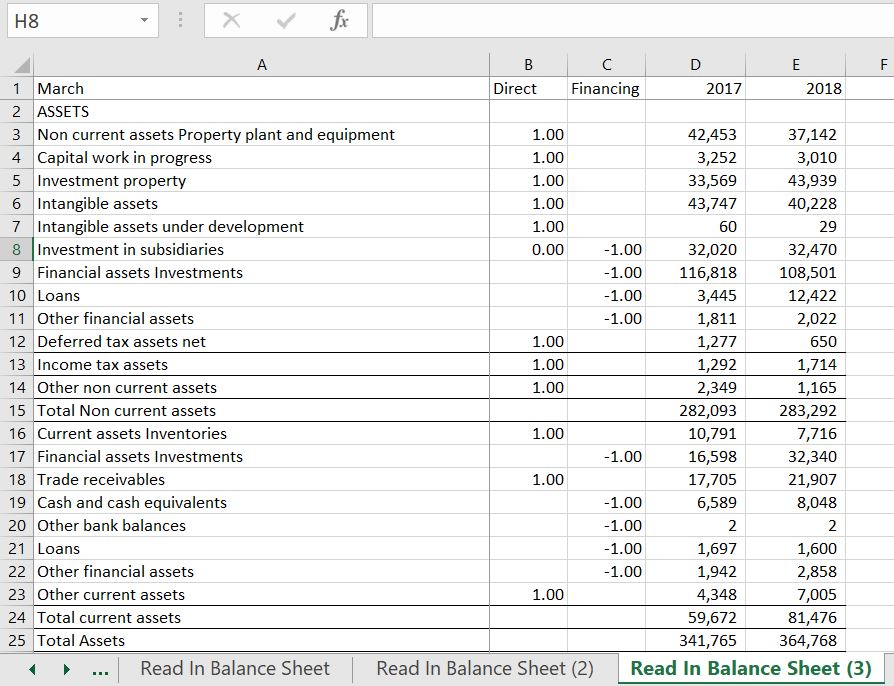
Computing Invested Capital and Classifying the Balance Sheet
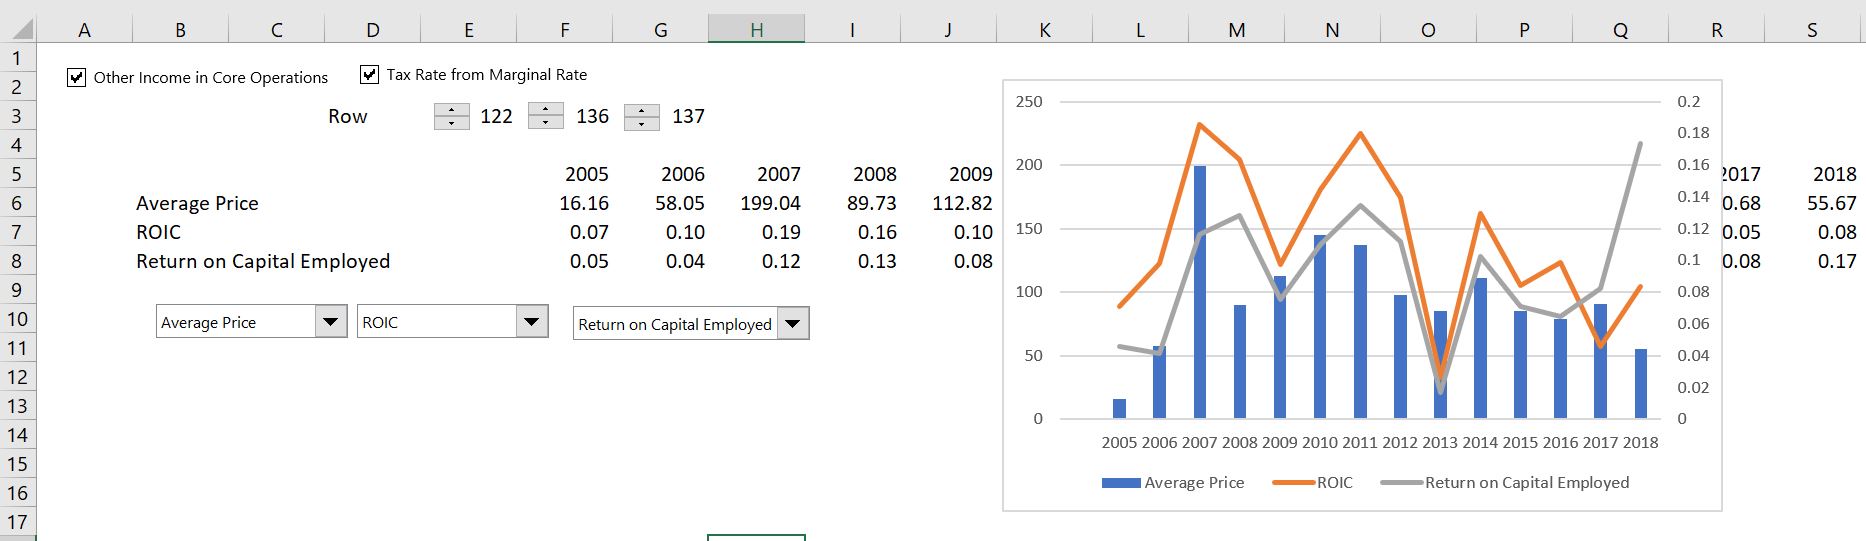
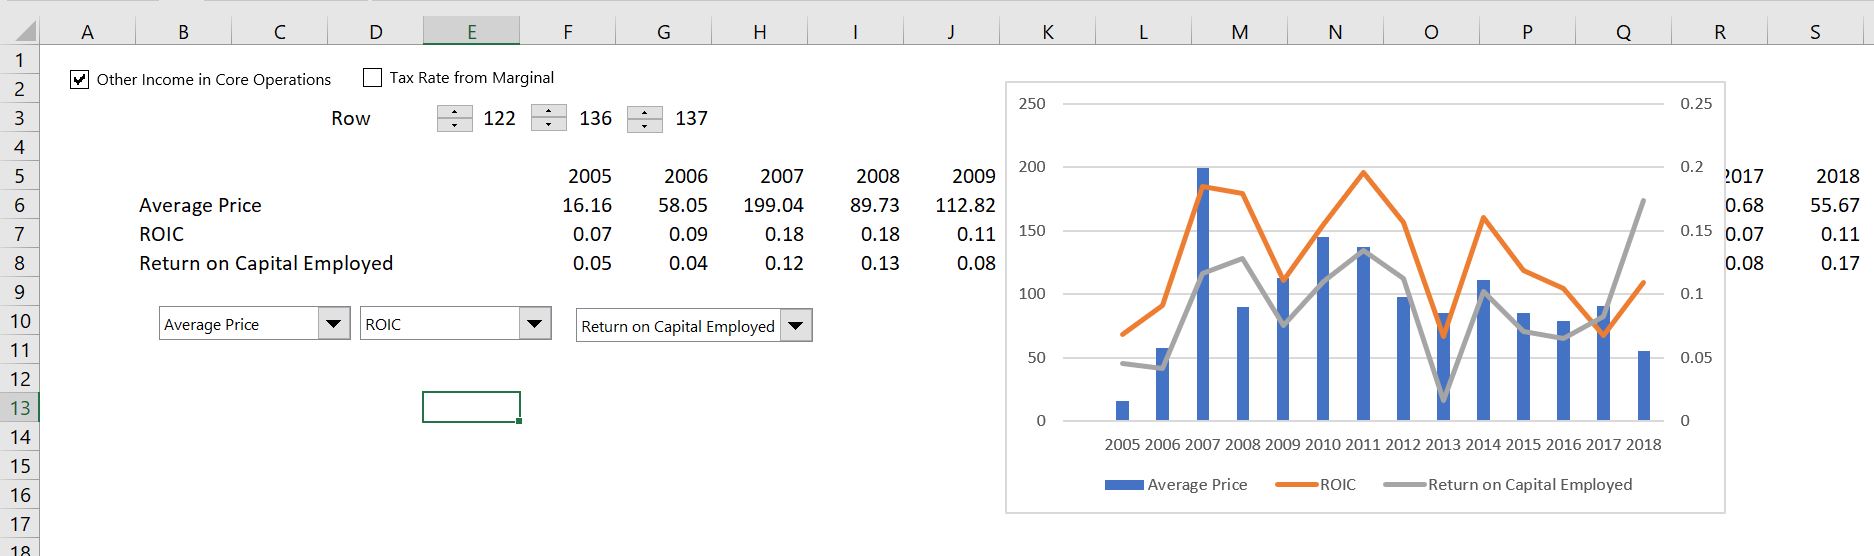
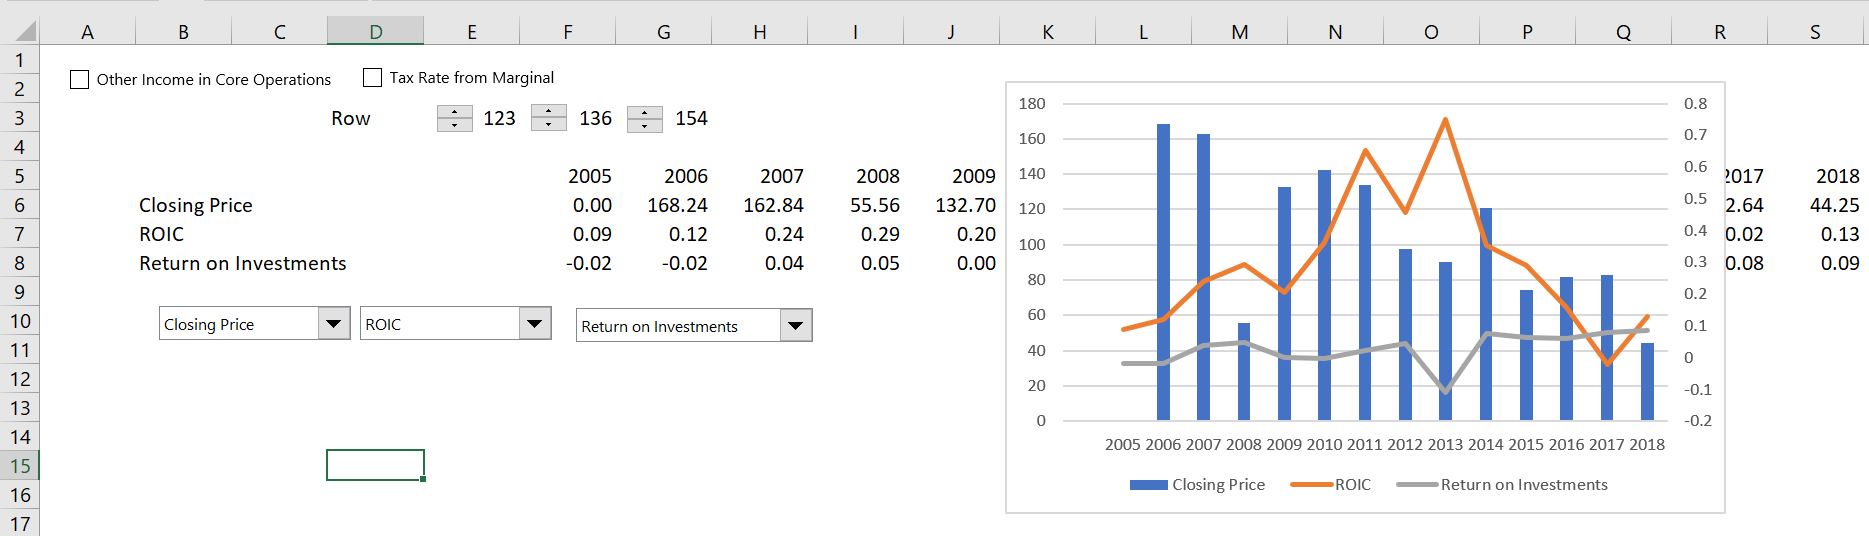
I will keep emphasizing that if somebody gives you a rule and tells you that is the only way to compute ROIC, you should say B.S. — but spell it out. The idea is to decipher what is really in accounts like other income and other investments. On the screenshot below, the return on capital employed is provided by the moneycontrol that I used to download the data. In the third case I use the closing price and present the return on other investments. In this case you get a dramatically different result. These results are explained further in the paragraphs below.
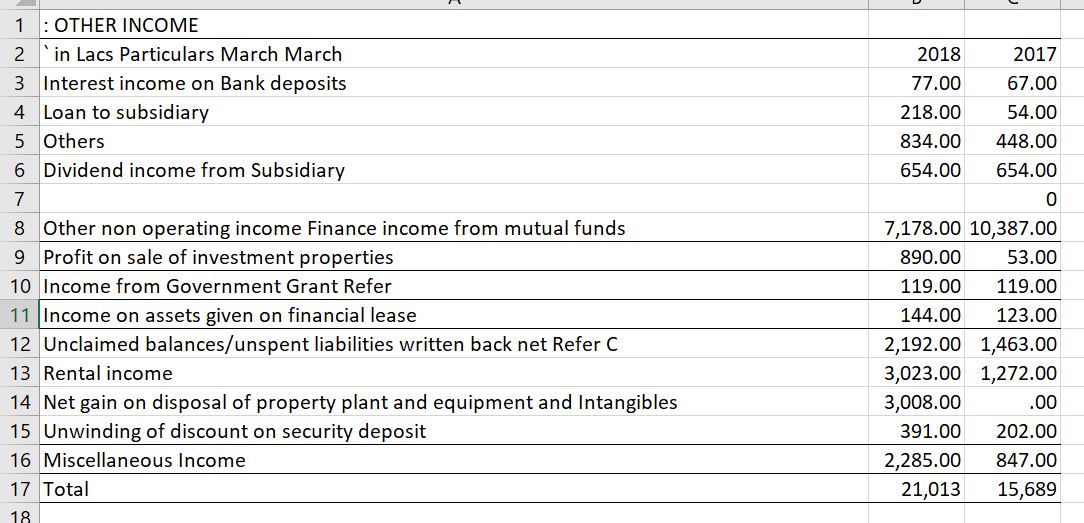
Computing NOPAT and Being Careful with EBITDA Definition
The screenshots below illustrate what happens when you make some different assumptions in computing NOPAT. To illustrate the judgment in computing ROIC consider the case below for HT Media in India. You can look at the numbers in the file attached to the button below. You can try working with the pdf converter by going to the link below and then opening the file and finding the financial statements around page 72 (SHIFT, CNTL, N to find page numbers in acrobat).
http://www.htmedia.in/wp-content/uploads/2018/08/HTML_AR_2017-18.pdf
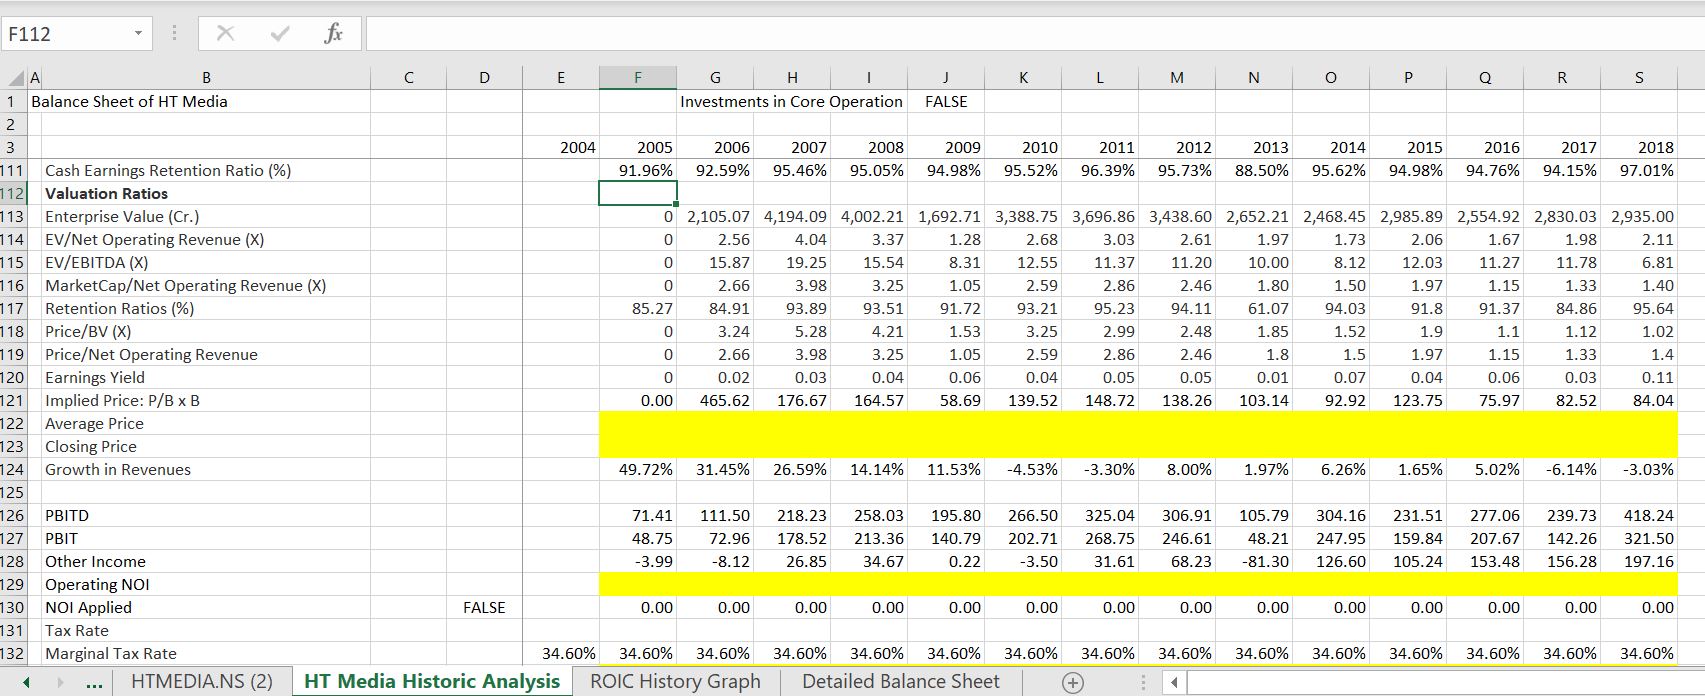
Presenting the ROIC with Other Statistics Using the INDEX Function
So the first case assumes that other investments are related to core operations and that other income and the third case assumes that other investments and the associated income is not part of invested capital.
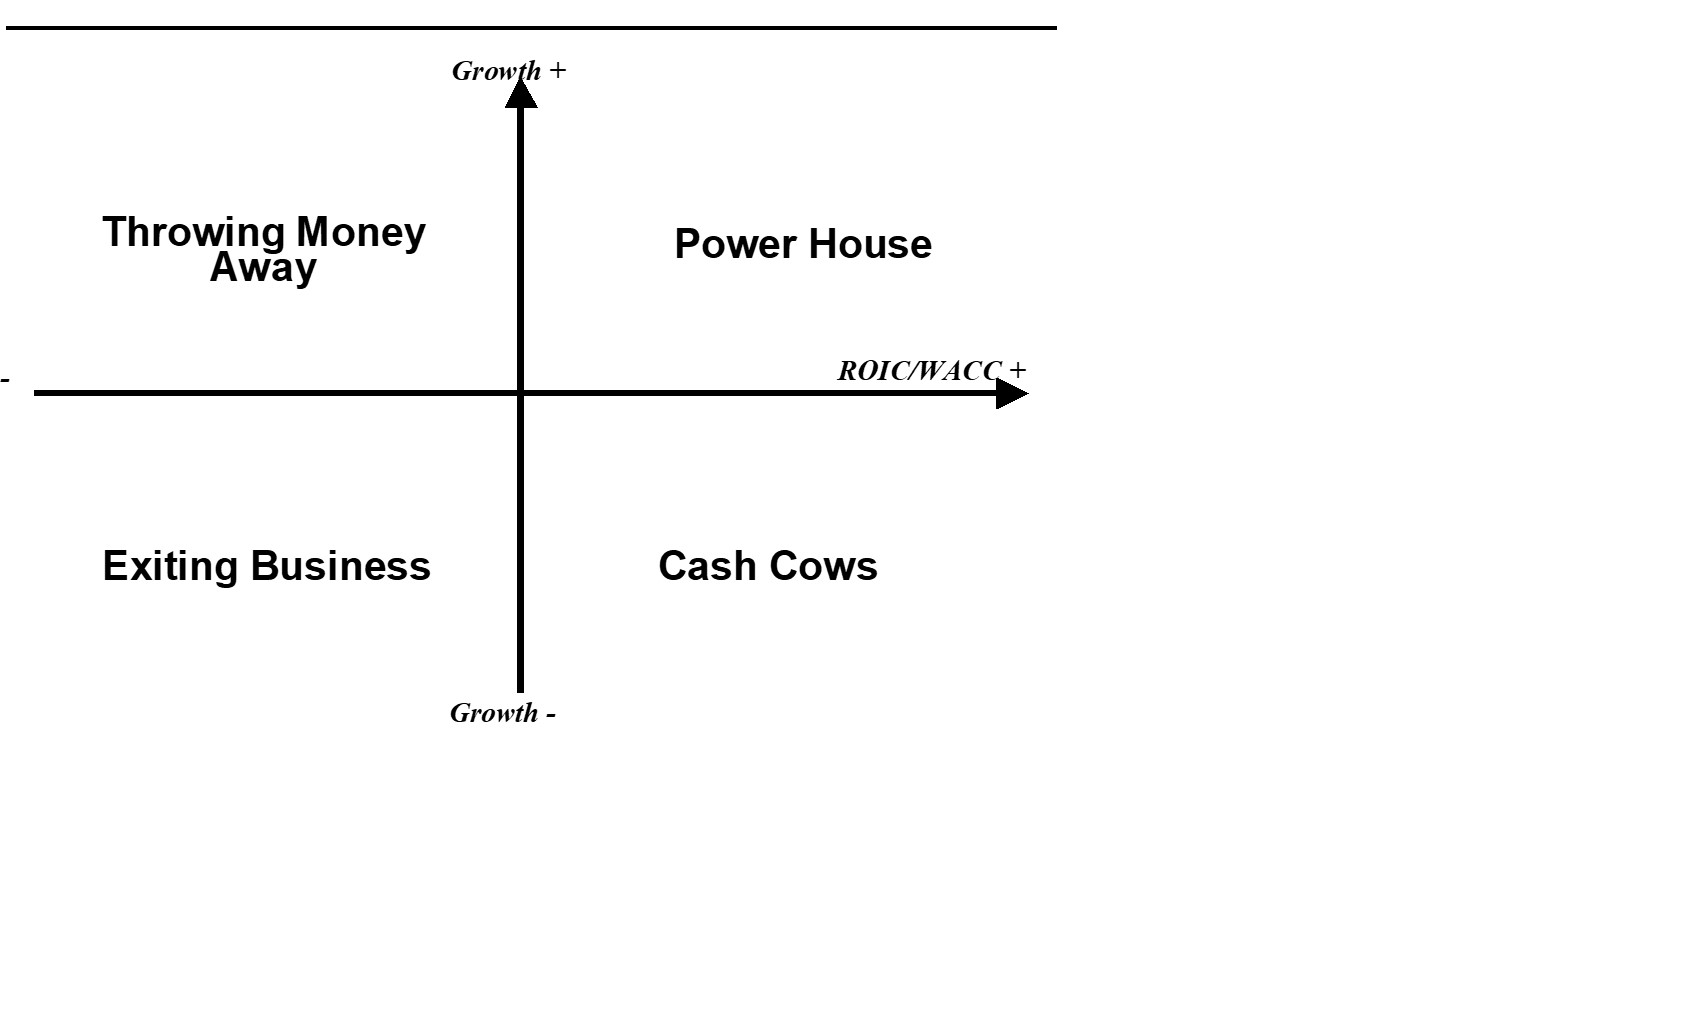
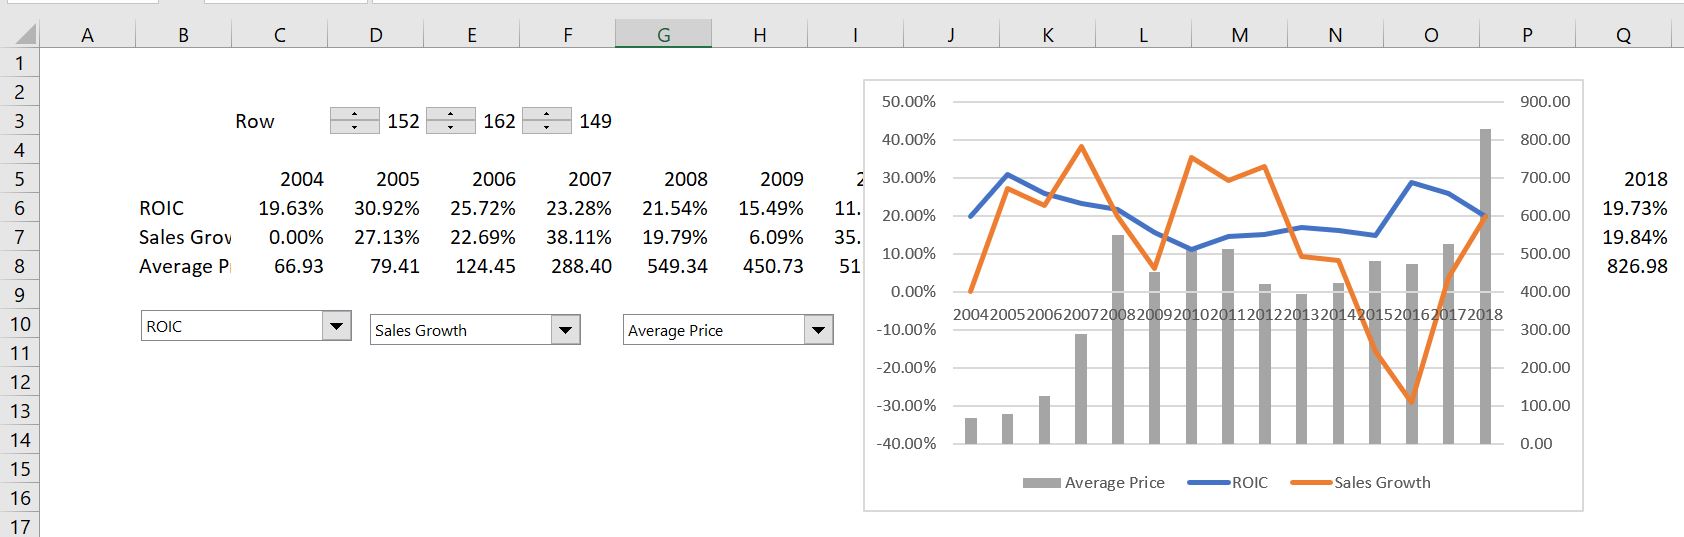
Here is another story for Reliance Industries in India. The company was earning a high return on invested capital and the issue was growth.
Complications from Write-offs, Asset Disposals, Re-structuring Charges and Other Items