This page shows how you can analyze historic merchant electricity price data for the German market without paying prices charged by eex.com. With the historic German merchant price data you can compare the German electricity prices to European natural gas prices and gain some understanding of how the market has evolved. While this page includes prices back to the year 2000 on a quarterly basis, you can review, you can much better hourly data on the German market from the Nord pool website since 2020 (and you are not hostage to paying for data and the absurd non-transparency that was previously in the market). You can combine this data with European gas prices that are extracted from the World Bank Pink data sheet and evaluate market heat rates and market spark spreads. On this webpage I try and explain how you can download the prices that are available without having to go around and search every few months for a differnt link.
As background, I went to the German electricity market called eex.com to download german electricity merchant prices and I discovered that I have to pay for the data. Of course I could not do this. I have rambled on about this lack of transparency in a market that is supposed to be efficient and allow new entrants to evaluate investments at the bottom of this page. Anyway, you can at least download quarterly data on German merchant prices which is ok for the kind of analysis that I often use to discuss merchant prices. The quarterly merchant electricty price analysis shows some interesting trends in spark spreads and in implied heat rates. So, I put the German price together with natural gas prices from the World Bank and with Exchange Rates from the FRED database. Once you do this you can quickly update all of the data by pressing a couple of buttons.
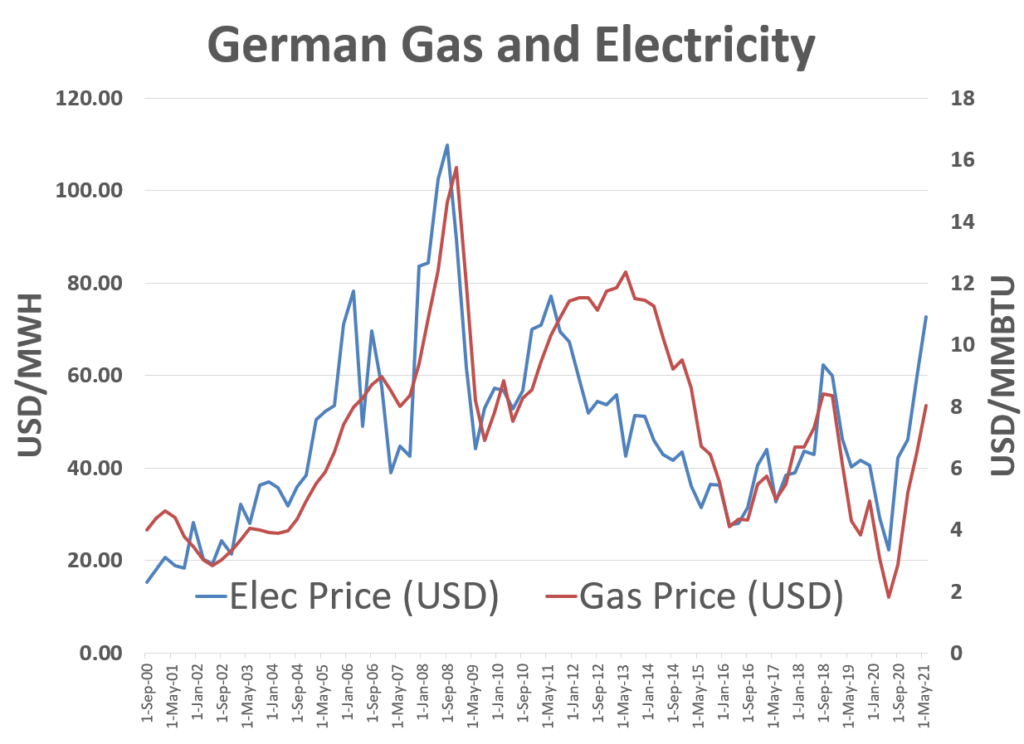
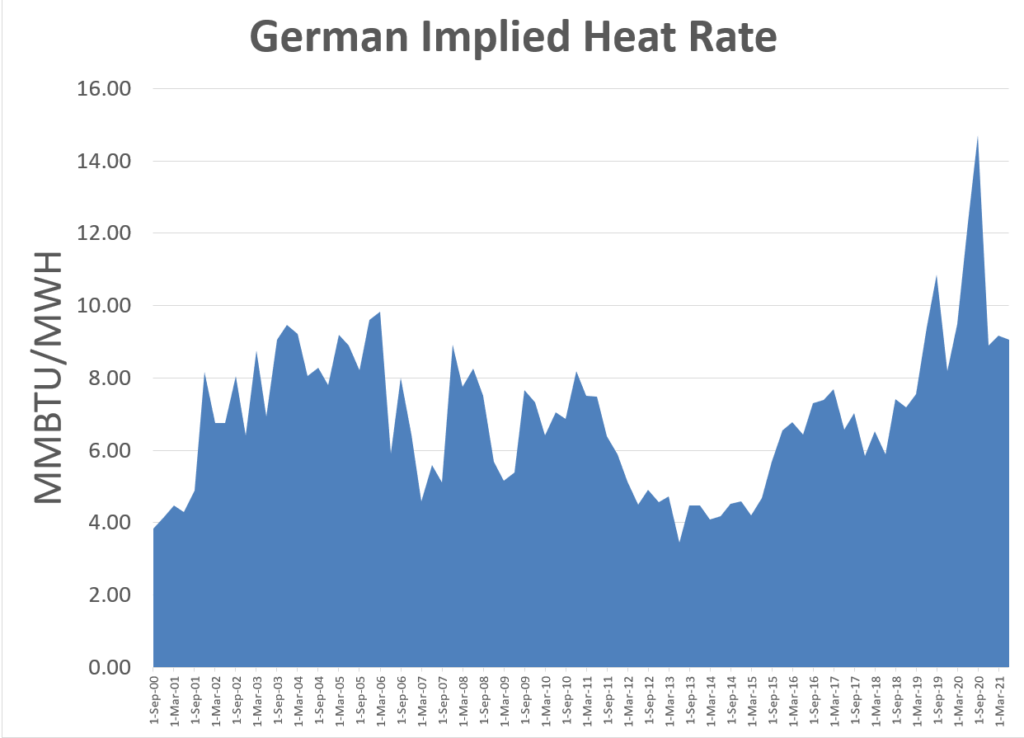
A summary of the graph that is produced from the file is shown below (this can be updated as explained below). The graph demonstrates that, like so many other markets, there is a strong correlation between electricity prices and natural gas prices. Further, the graph shows that there was a long period of low electricity prices relative to natural gas prices starting in 2011. From 2008 onwards there was a reduction in demand that affected the relationship between gas and electricity prices that shows up in the implied heat rate. This was also associated with increase in renewable. When the gas prices crashed in 2020 with competition between Gasprom and US LNG, the electricity prices also plumented. The implied heat rate increased, but this did not really imply an increase in the profit on gas plants as illustrated by the simple little example below
- Implied Heat Rate = Electricity (USD/MWH)/Gas (USD/MMBTU) = MMBTU/MWH8Electricty Price 100
- Gas Price 12
- Heat Rate 8.33
- Profit with Heat Rate of 7 –> 100 – 12*7 = 16
- Electricity price 20
- HR = ELEC/Gas; Gas = Elec/HR
- Gas Price = 2.4
- Profit with Heat Rate of 7 –> 20 – 2.4 * 7 = 3.2
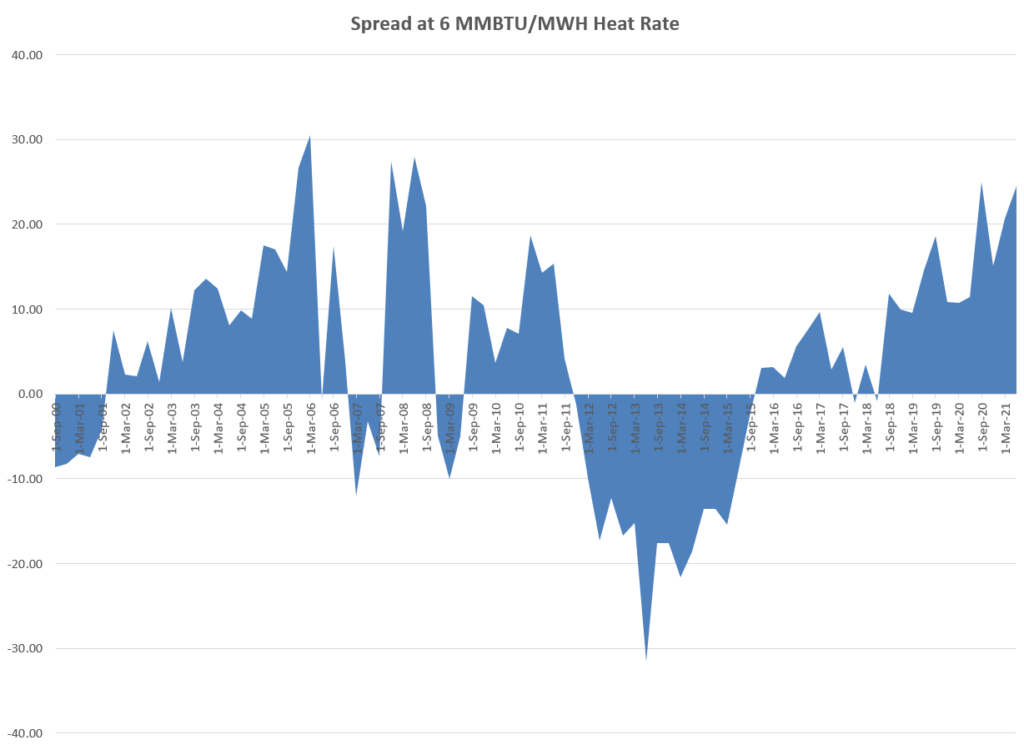
An alternative caclulation is the spark spread with a given heat rate. Using a 6 heat rate, the graph illustrates the problems for natural gas plants relative to history.
Retrieve German Prices.xls
Updating the German Merchant Price Data by Yourself
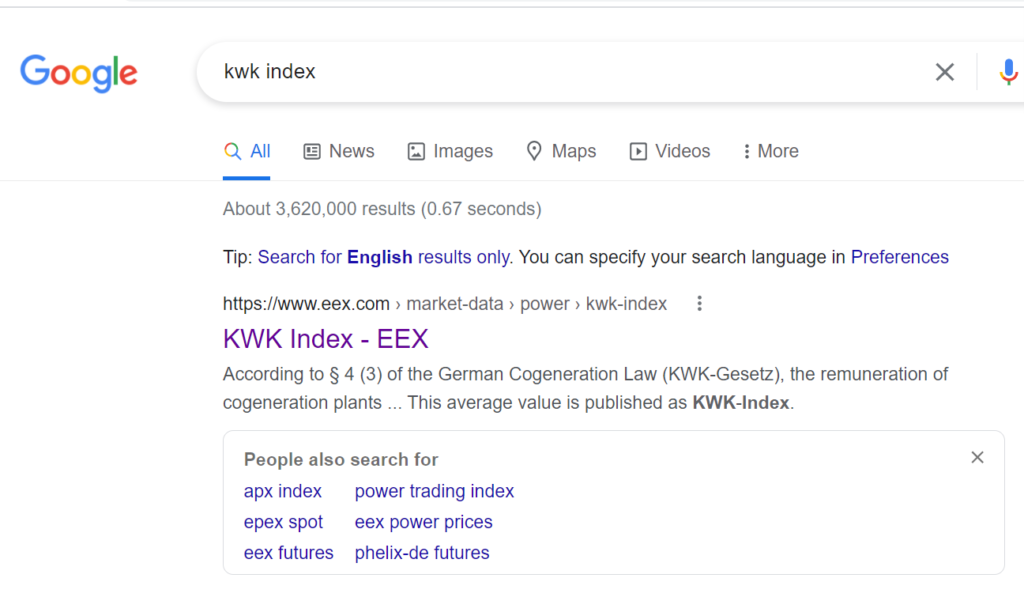
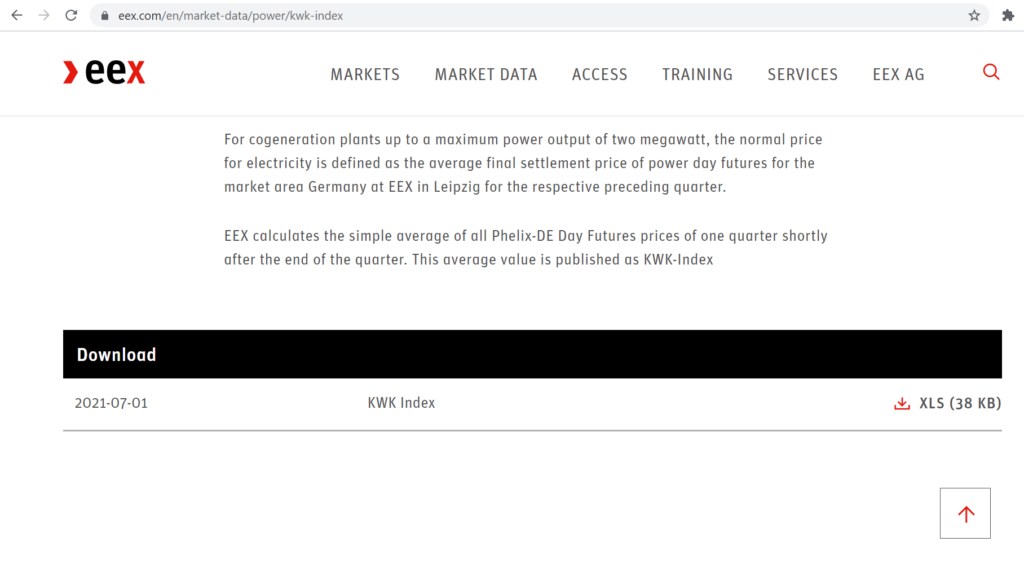
The file attached to the button above contains the German prices. This is derived by downloading something called the KWK index. As the eex.com website seems to continually change the link, I have found it best to just google the kwk index as they apparently must publish this data. Once you go to the index, you can right click on the download button shown in the second screenshot. After right-clicking on the download, you can copy the link into the the file that is attached to the button.
You can download the file below and it should all work. The link for the free data (that is sometimes updated) and the general link is shown below:
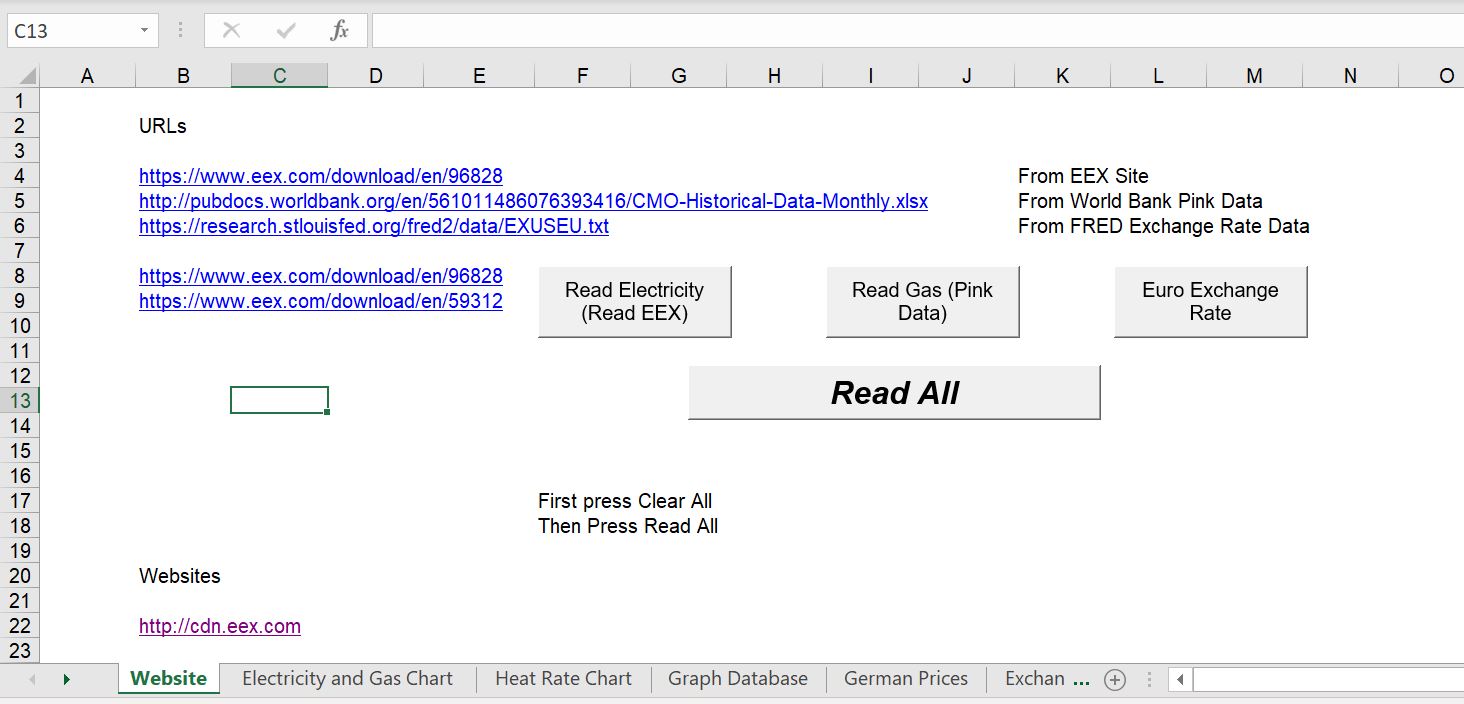
When you open the file, you should see a page like this. When you press the Read All button, the macro should go to three websites to read data for the electricity prices, gas prices and the exchange rates.
You may have to update the URL for the monthly data using the world bank data. To do this, go to the world bank website on commodity prices using the link:
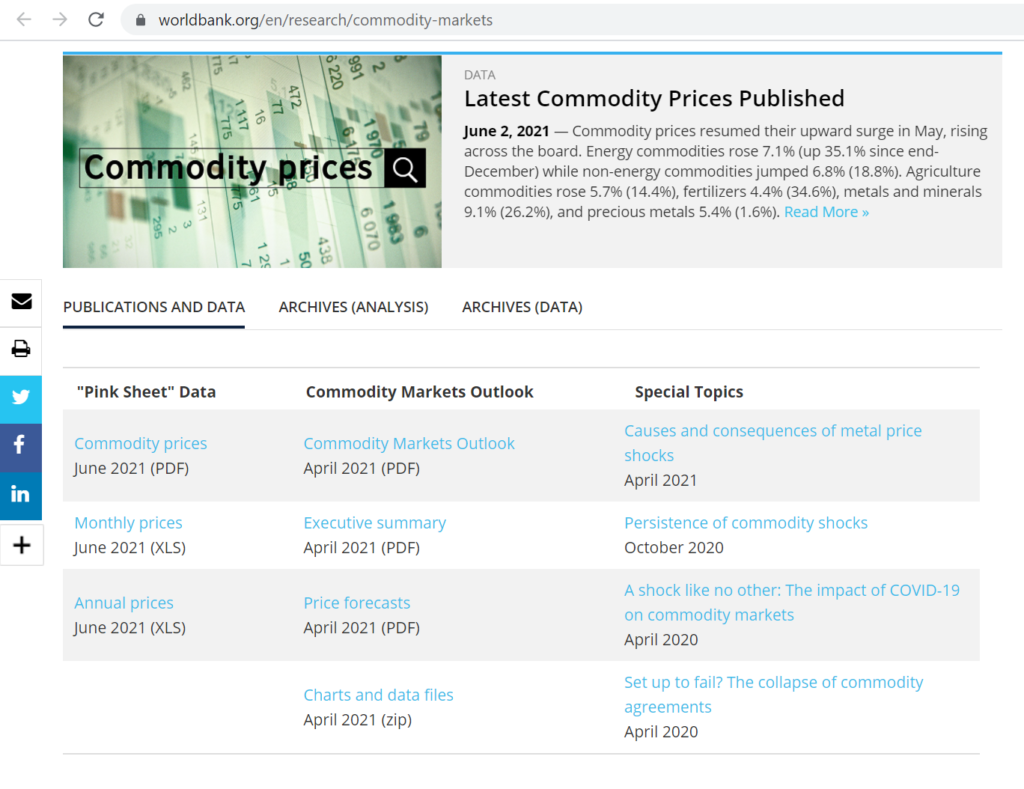
The link that was relevant for 2021 prices is the link below. It is very possible that this link will change and you will have to update the file to read the natural gas prices.
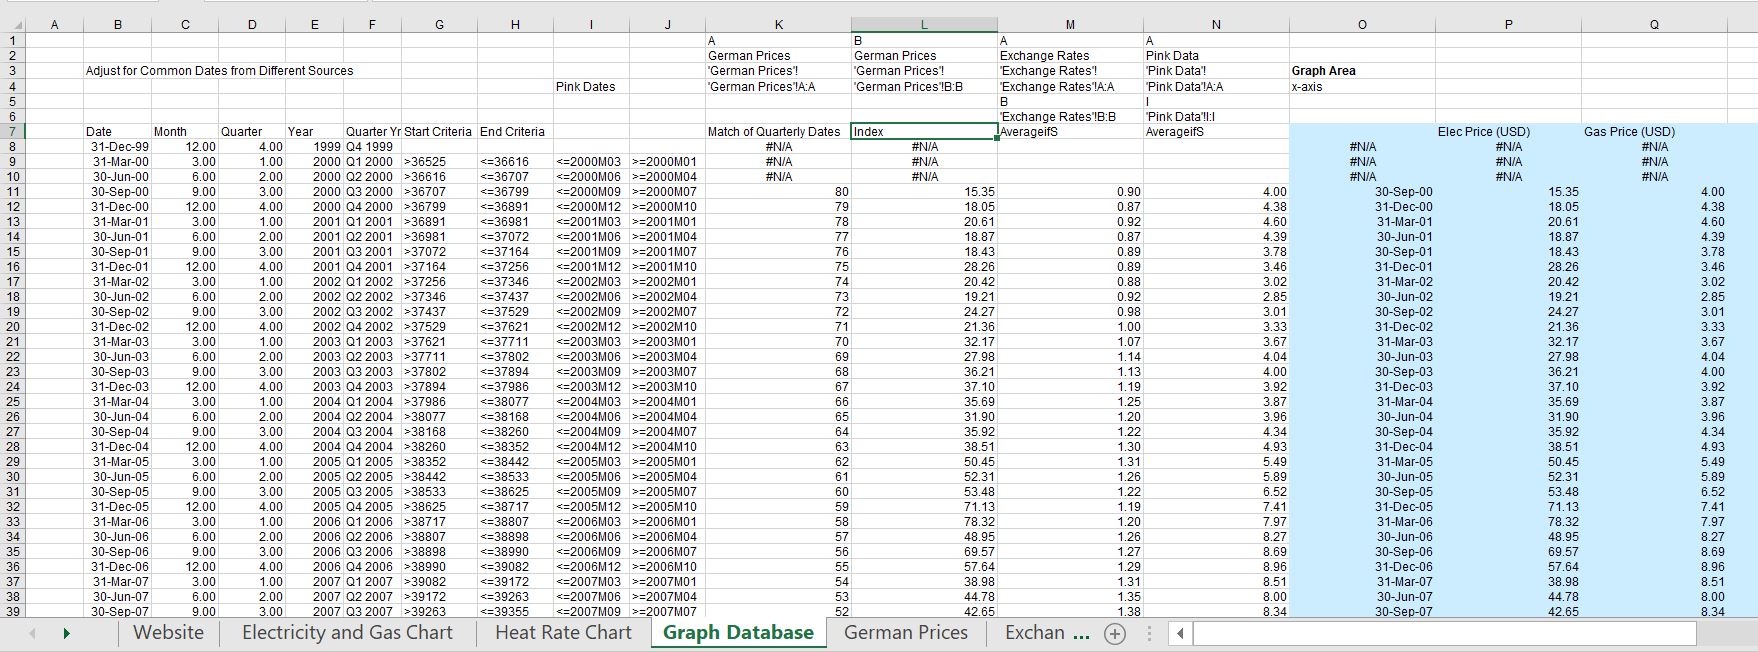
The way the file works to make the graphs is illustrated in the screenshot below. You should first set up a set of dates that work with the different downloads. In this case. The good news about the German merchant electricity prices is that you can press a button in the website page that is titled “Read All” After pressing this button, the merchant prices, the gas prices and the exchange rates should automatically be read in. You can then look at the graph of electricity and gas prices as well as the implied heat rate.
Case Study on German Prices
The German prices demonstrate the effect of renewables on electricity prices. You can look at the relationship between gas prices and electricity prices. First note that the strong correlation between gas and electric. Next look at the heat rate and the change in the relationship. One of the reasons for the declining heat rates is probably the increased renewables. Maybe also the declining demand.
Lack of Transparency in EEX and German Prices
This inability to get a database on Germany merchant electricity prices also really stinks because one of the basic objectives of merchant markets is to have transparent prices. Transparent prices can be used by consumers and can be used; transparent prices can be used to prevent bribes for high price contracts; transparent prices can be used by investors to decide what kind of plant to invest in; transparent prices can be used by consumers in deciding whether to lock into long-term contracts; transparent prices can be used by consumers to evaluate the benefits of demand response, and on and on and on.