This webpage demonstrates how to perform an economic and financial analysis of batteries in the context of electricity who pay retail tariffs with demand charges and varying energy charges. Retail electricity bills often depend on a demand charge and storage analysis must measure how demand charges can be reduced by using batteries to reduce load during peak periods and charging the batteries during off-peak periods. The analysis incorporates variation in day-by-day load and day-by-day solar energy as well as financial effects of replacing batteries over the life of a solar project. Battery analysis is added to the retail rate analysis where the case without batteries is presented and compared to cases with batteries and no solar; to cases with batteries and solar; and to a case with only solar.
As with the microgrid storage analysis, the retail rate analysis evaluates different loads and solar patterns over a month with various assumed retail rate costs, solar costs and battery characteristics as well as hourly demand and hourly solar irradiation over the month. The manner in which you input items and the way the carrying charges work to determine solar and battery prices are explained below on this page. But to begin, a single day synopsis is used to work through how the economic analysis works and as well as how battery operation works. The one month presentation can easily be extended for an entire year or even for multiple years. The file that contains the economic and financial analysis of rate structures, solar power and battery operation is available for download the file by clicking on the button below.
File with Analysis of Retail Rates that Evaluates Different Scenarios with Batteries and Solar Power
Summary of Retail Rate Results with No Solar or Battery
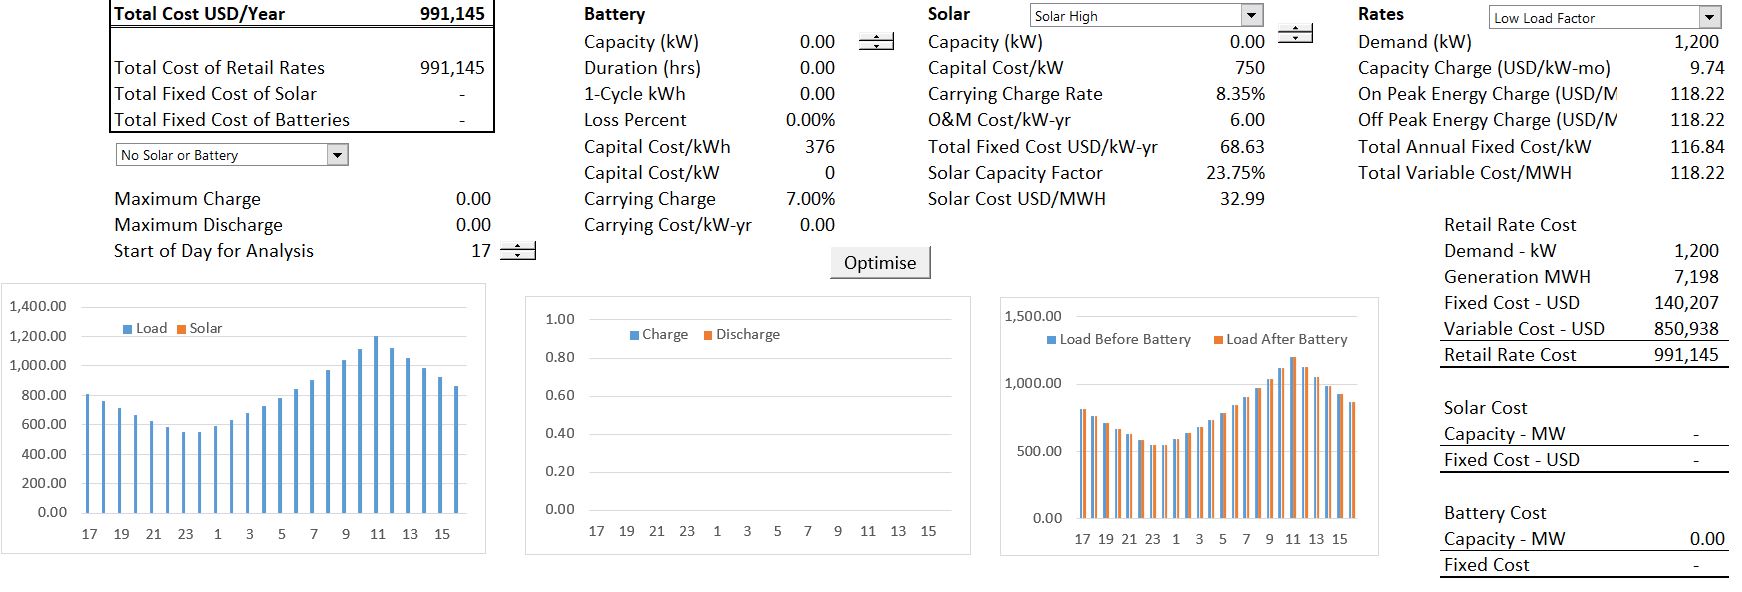
The screenshot below demonstrates how results of the retail rate analysis are presented. The general idea is that retail electricity use per hour (load) after solar production must be derived from somewhere. It can be met by paying retail rates, production of solar power, or use of batteries (that really moves the loads around). The costs of meeting load from retail rates; from solar power; or from batteries is shown on the summary page. In the first example, there is only retail load with a picture of the load on the bottom left of the summary page. Note that the total annual cost of this alternative is 991,145 per year for a demand of 1,200 kW and use of energy of 7,198 MWH. The cost of electricity is a function of the peak load with drives the demand charge (named capacity charge in the excerpt) and the energy which drives the energy charge. In this case the demand charge is USD 9.74 per month and the energy charge is a very high level of more than 11 US cents per kWh. Computation of the retail rate for the year is shown in the right column. There is no cost for the battery or for the solar panels.
Scenario with Battery and Retail Rates
In the second case, batteries are added to the retail analysis without solar power. When adding batteries to the retail rate analysis, the size of the battery must be selected as well as how the battery will be operated (this is just a scenario analysis with zero battery capacity). This is makes the analysis more complex and is illustrated on the graph on the right. The battery analysis allows the blue load line to be flattened. The off-peak loads increase and the on-peak loads are reduced. The technical problem is finding the flat level of loads that produces the lowest cost or peak demand. The manner in which batteries are charged and discharged is shown on the middle graph. This graph demonstrates that more load is used for charging than for discharging because of the efficiency assumptions.
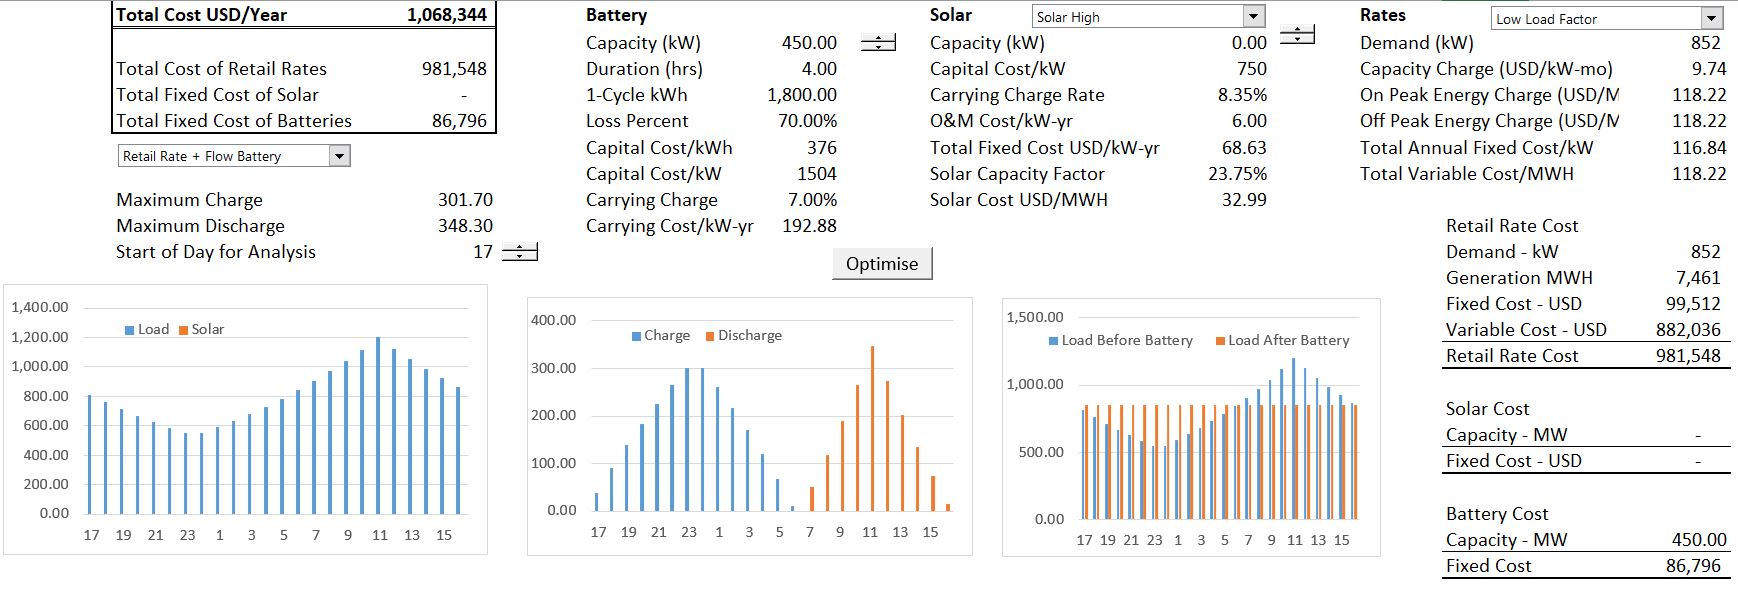
The electric rates are reduced in the scenario with batteries from 991,145 per year to 981, 548 per year because of the reduction in demand that is created from storage. But this reduction in demand is offset by the fact that you must pay for the battery. The cost of batteries is evaluated with a carrying charge rate where up-front cost is allocated across years of the battery life to derive an inflation adjusted annualised cost of the battery (see the carrying charge section for much more discussion on this). There is a whole financial model underneath the carrying charge rate that includes assumptions about interest rates, equity returns, decommissioning costs, degradation, capital structure and tax depreciation. In the case shown with the screenshot above the battery cost is 192.88 per kW per year which is higher than the demand charge. This means means that more must be paid to reduce the demand than to increase demand.
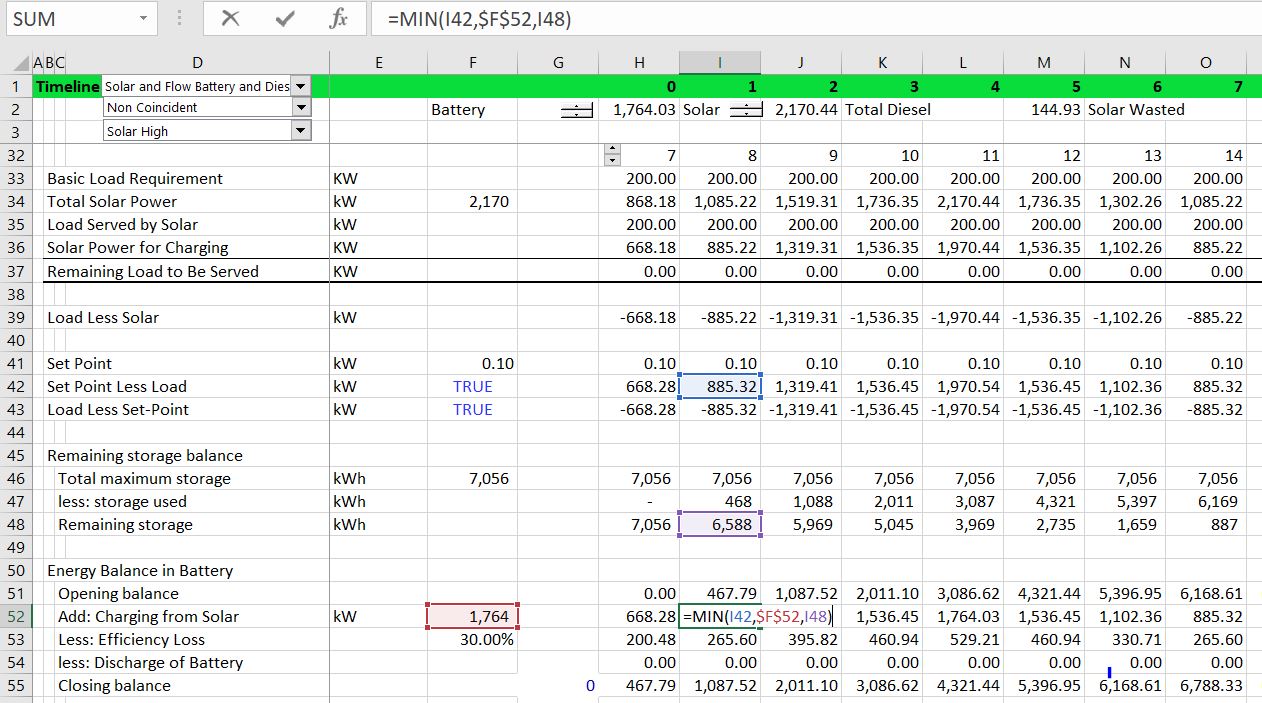
The method of using a set-point and accumulating the battery storage is illustrated in the screenshot below. When the electricity load is less than the set-point, the battery is charged. When the load is greater than the set point, the battery is discharged. The battery cannot be charged by more than its capacity. The battery cannot be charged by more than the storage capacity of the battery. The charging formula is illustrated in the screenshot below.
Case with Retail Rates and Solar
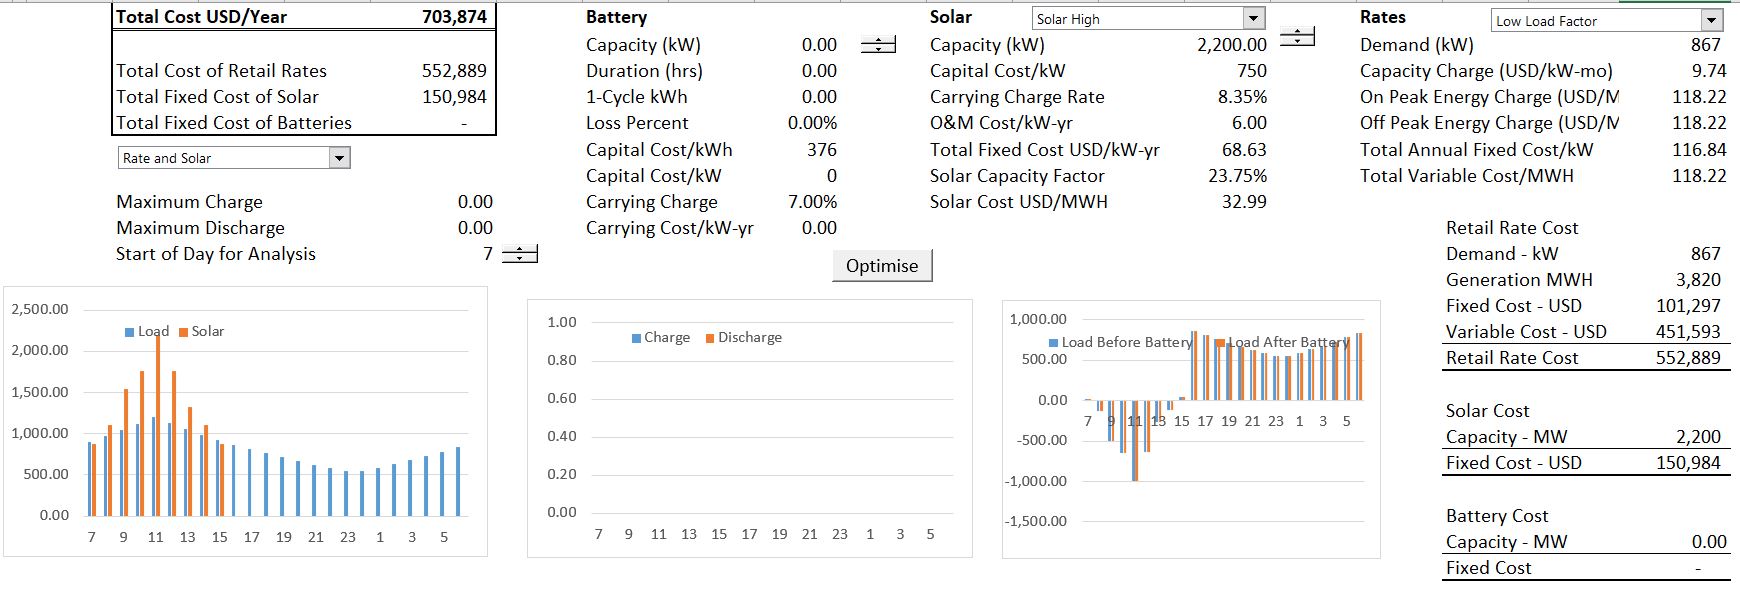
The third case demonstrates the case where the consumer pays retail rates and includes solar power but does not include battery storage. You can change the amount of solar power and determine how much to install to minimize electricity rates (the optimal sizing is different with and without battery storage). There may be some hours when the amount of solar capacity exceeds the electricity load. Note that could compute the optimal amount of solar. When you put in different amounts of solar with the spinner box, you can look at the total cost. You could make a data table or write a macro like the one below to evaluate the optimal amount of solar capacity. The optimal amount may result in more solar power than can be used as illustrated in the screenshot below.
In this case a battery may be beneficial because the solar power can be used and then transferred to different time periods. Note that because of the energy price of USD 118 per MWH and the low cost of solar with a levelised cost of USD 32.99/MWH that the solar power reduces rates. This occurs even though solar is wasted and a demand charge must still be paid.
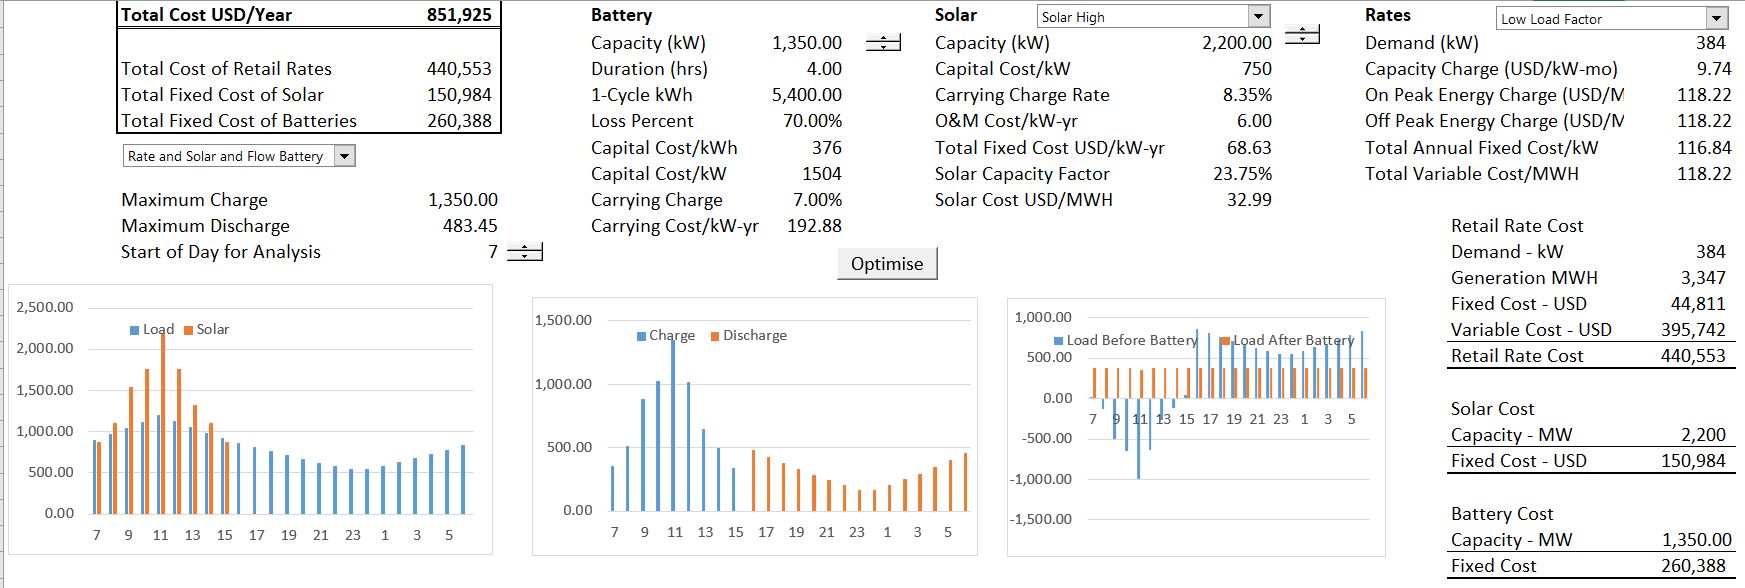
Case with Retail Rates, Solar and Battery Storage
The final case includes both solar and the battery in the retail rate analysis. In this case when the load after solar is less than zero, this load can be used to charge the battery. The case with both battery and solar shown in the screenshot below. You can try different battery sizes and then press the button to optimise the set-point.
Inputs to Battery, Solar and Retail Rate Analysis
In this section I explain some of the key inputs that go into the storage and retail rate analysis. There are a lot of factors that must be considered in the analysis including technology costs, financial parameters, load shapes, solar energy patterns, retail rates and others.
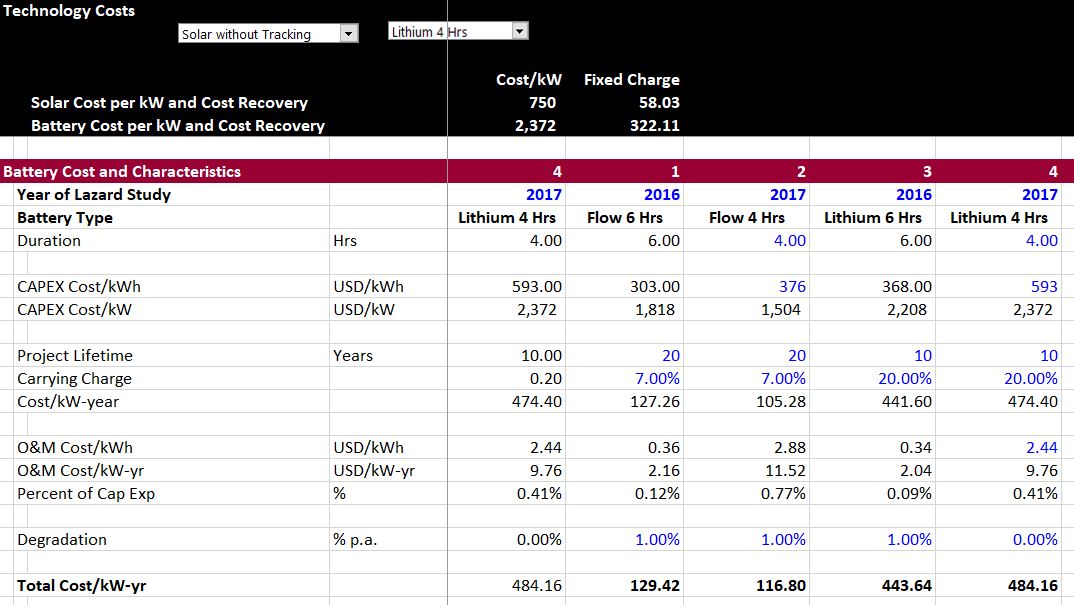
The screenshot below illustrates the technology costs for batteries. Similar assumptions must be entered for solar (and in the diesel case, for variable costs of operating diesel). After entering the assumptions for different assumptions, the index function is used for selection (along with a drop down box).
Set Points for Battery Operation with On-Peak and Off-Peak Prices
One of the tricky things in analysis of batteries and storage is determining when to charge the battery and when to discharge the battery. To illustrate the issue with retail rates consider the following unrealistic and extreme scenario.
- Assume that there is only one off-peak hour (with solar this could be one hour of sunlight).
- Assume that the load is flat for all 24 hours of the day.
- Assume that the on-peak prices are very high (say 150/mWh) and the off-peak prices are very low (say 20/mWh).
- Assume that the demand charge only applies to on-peak periods.
If you had put in a set-point to charge the battery when load is above the set-point and discharge the battery when the load is below the set point, you could not calculate a number. If the load is flat, there would be no way to use a number to decide when to charge and when to dis-charge.
If, instead, you put a different set point for on-peak and off-peak periods, you could charge the battery during the one off-peak hour and then discharge it during the on-peak hours. So, if the load was flat at 100 kW, maybe you would use all of the load of 100 kW during the off-peak period and then discharge the load equally in the other on-peak periods. In this case the set-point for the off-peak period would be 0 kW. You would compute the load-set point and charge the battery subject to constraints that there is 100 kW of battery capacity and also that the battery has no previous storage. Then you could discharge the battery over the remaining 23 hours which would yield 100 kW divided by 23 or 4.35 kW per hour. This 4.37 kW would be the on-peak set point that defines the discharge.
You could potentially do more by buying a bigger battery. Lets say you buy a battery with 200 kW of capacity rather than 100 kW. Then you can buy off-peak energy and use the energy to discharge 8.70 kW of energy for the on-peak period. Maybe you even buy a 2,300 kW battery and discharge the battery with 100 kW so you would remove all of the on-peak load. In this case the off-peak set point is 2,300 kW and the on-peak set point is 100 kW. These examples demonstrate that the optimisation process involves first estimating the battery size and then trying different on-peak and off-peak set-points to find the optimal battery operation given the battery size.