This page discusses the structure of your model which is more important than how fast you type in excel; how pretty colours you use in your model; how much you follow some kind of rules for modelling; or how good you are at making fancy graphs that do not mean very much. In discussing modelling philosophy, I have chosen to be flexible rather than perfectly structured (if you think about your life, sometimes it is good to be structured, sometimes it is better to be flexible and many times these objectives conflict). The people taking care of my 90 year old father tend to be very structured and only take him out bed at very distinct and distinct times. But I think they should be more flexible and if he is moaning that he is tired, just let him relax and sleep. It will not make much of a difference in the world if he wakes up an hour later. This is the conflict. For modelling, you may want to begin with the Structuring part of a model. Structuring issues essentially involve where should you start (with a time line) and how the model should progress. These issues in turn drive the order of the assumptions in your model.
Sheet Order – Depends on Debt Sizing Method and Your Opinion
Option 1 – Development, Construction, Sources and Uses, EBITDA, Debt: Time Order of Constructing and Financing Projects. Use the following order of items and put in different sheets. This works when the financing is set from the capital expenditures and not from the CFADS. Start with development; move to EPC and construction; sources and uses of funds with financing; operations with revenues and expenses; depreciation, debt schedules and finally financial statements with a cash flow waterfall. In this case, the sheet order may be:
- Input Scalars
- Input Time Series
- Sheet with Time Line Analysis (Simple Formulas)
- Development and Capital Expenditure Analysis
- Construction Financing with IDC, Fees and Other Thing that Cause Circular References
- Operations Analysis starting with capacity and volumes including EBITDA
- Debt Schedules with Repayment and Interest
- Waterfall and Financial Statements
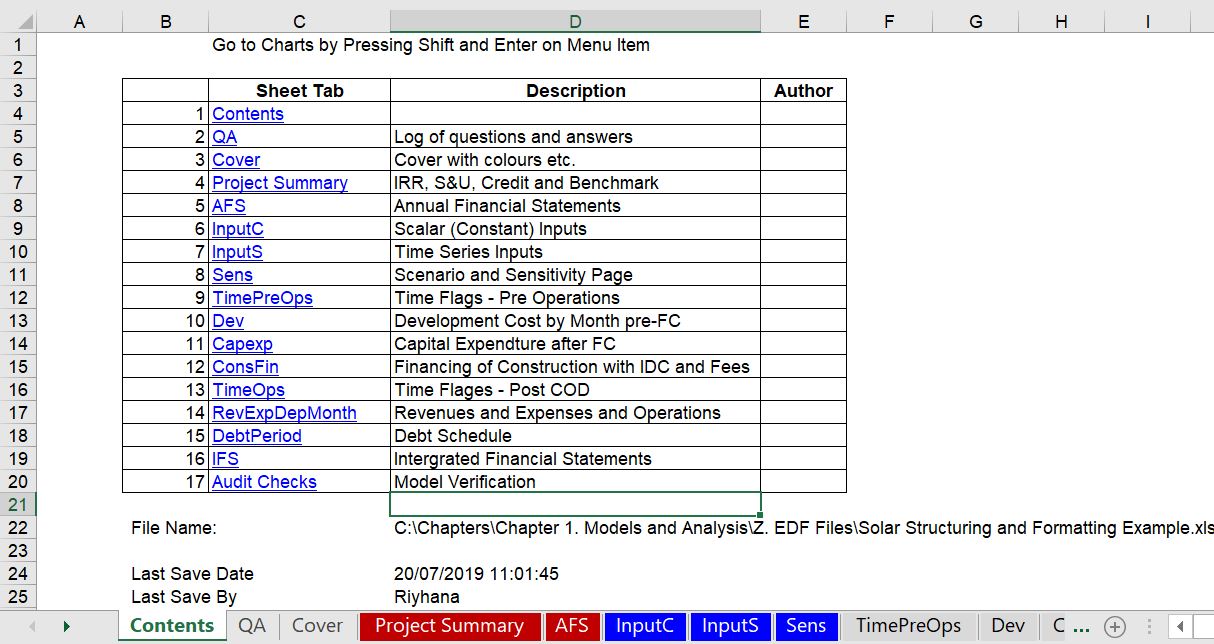
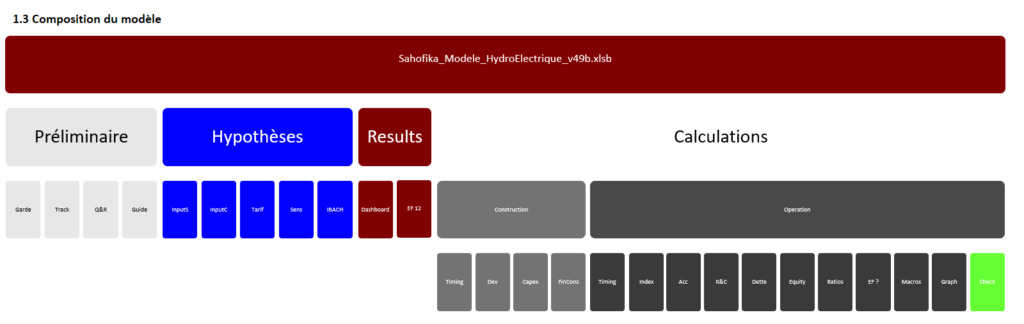
At the beginning of the model there should be standard summary sheets the present the IRR’s, DSCR’s and other data. In addition there should be a scenario sheet and an annual summary sheet. An example of the sheet order is shown in the screenshot below. This table of contents was created from the generic macros file after you press CNTL, ALT, C. You can go to the webpage for generic macros and see how this
Option 2 – Merton Miller and Splitting up Operations from Financing: Begin with Operations and No cash; move to free cash flow without finance; then evaluate debt size from CFADS; then work on the sources and uses and finally taxes and cash flow waterfall. This works better when the debt size may occur from CFADS. If the debt can come from cash flow, you need the cash flow as well as the capital expenditures before you can derive the debt. In this case I strongly suggest a debt sizing section that is different from the basic debt schedule in the model. The sheet order may be:
- Input Scalars
- Input Time Series
- Sheet with Time Line Analysis (Simple Formulas)
- Operations Analysis starting with capacity and volumes including EBITDA
- Debt Sizing from CFADS (this will include a circular reference)
- Construction Expenditures and Financing (with more circular references)
- Debt Schedule and Waterfall
- Summary of Financial Statements
As with the other structure above where debt is derived from the uses of funds, there should be standard summary sheets the present the IRR’s, DSCR’s and other data at the beginning of the sheet. In addition there should be a scenario sheet and an annual summary sheet.
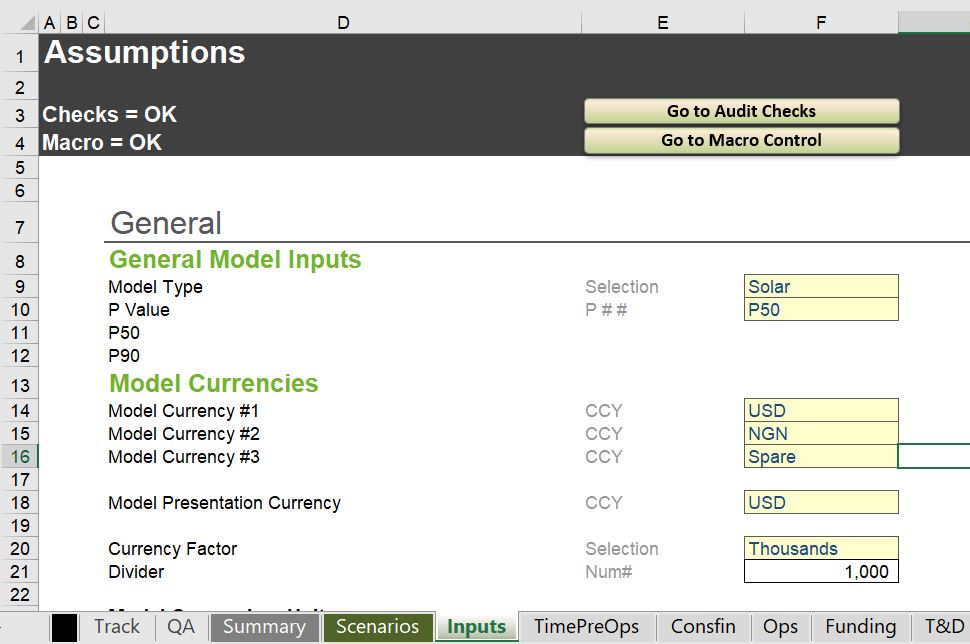
When you set-up sheets, you should put the order of the inputs in the same order as the way the assumptions are used in the model. You should start with dates and then move to macro-economic data and operations. You could also start with development costs and capital expenditures. In my opinion the financing should be after all of the operations, capital expenditures and revenues. Some people separate time series inputs from scalar inputs and put the time series inputs in InputS while the scalar in InputC. An example of what not to do is shown in the screenshot below. Here the inputs do not start with dates and the fancy colouring is in my opinion very irritating. The silly macros that go to the audit checks drive me crazy. I hope you are not impressed by this type of idiocy. I also object to the different fonts (where the name General has a larger size than the inputs, and the different colours that do not show you when you are moving to a different section of the model.
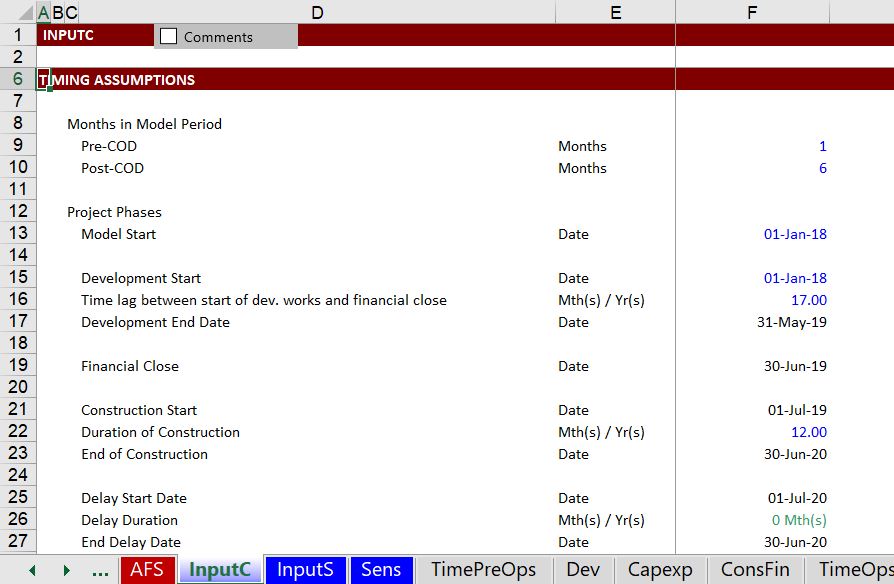
A better example of an input structure is shown in the screenshot below. You should start with the timing inputs; separate inputs in that are constants in one sheet from inputs that are time series that should be in another sheet. You should also use the generic macros file to colour the section headings and the inputs. After this section, you could move to the development cost section or the operating inputs section depending on how the sheets of your model are structured.
Spreadsheet Structure in Model
In the model below, the sheet structure made my head spin and looking at it still makes me a little crazy. The debt was sized from the CFADS, but you had to go to the control sheet to find the debt size, which in turn came from yet another sheet in the model and created a horrible to trace circular reference that was solved with the iteration button. To fix this I suggested beginning with a cash flow analysis and a section for evaluating debt size. This debt goes into a summary sources and uses statement can construction financing after the cash flow statement.
Formatting Sheet Structure in a Project Finance Model (The S in FAST)
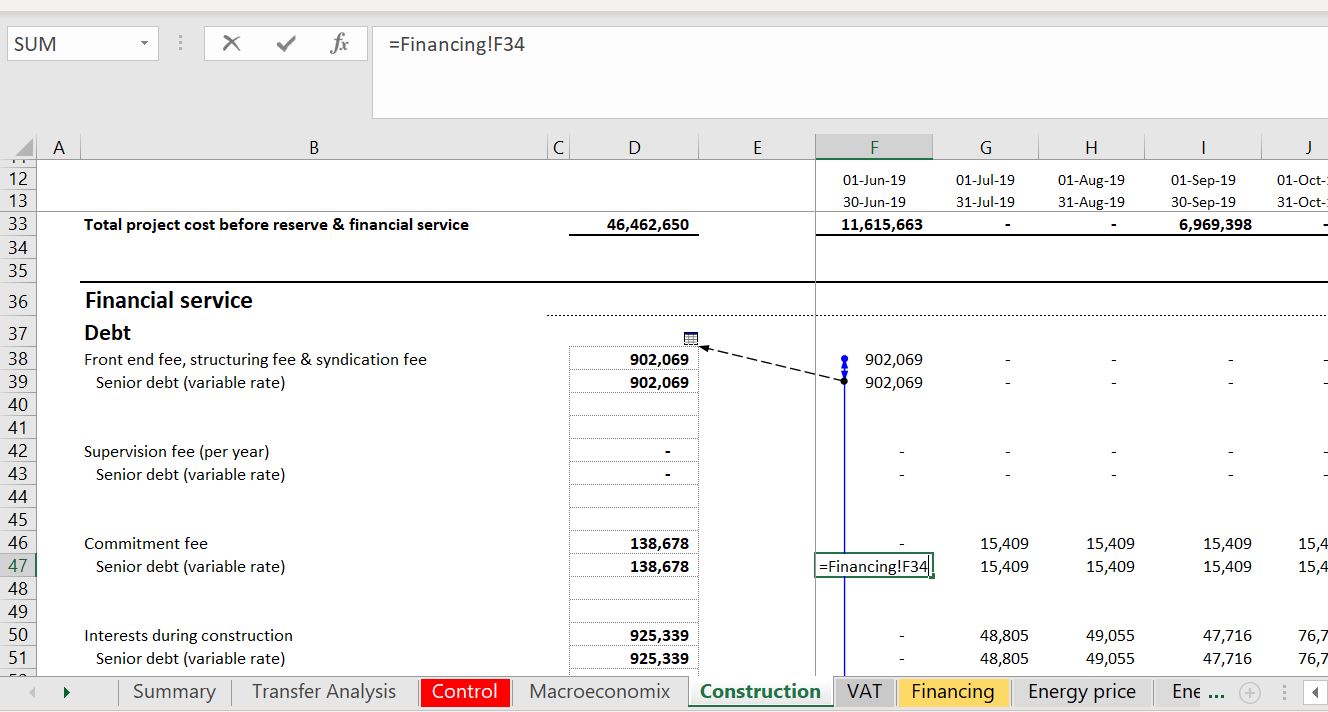
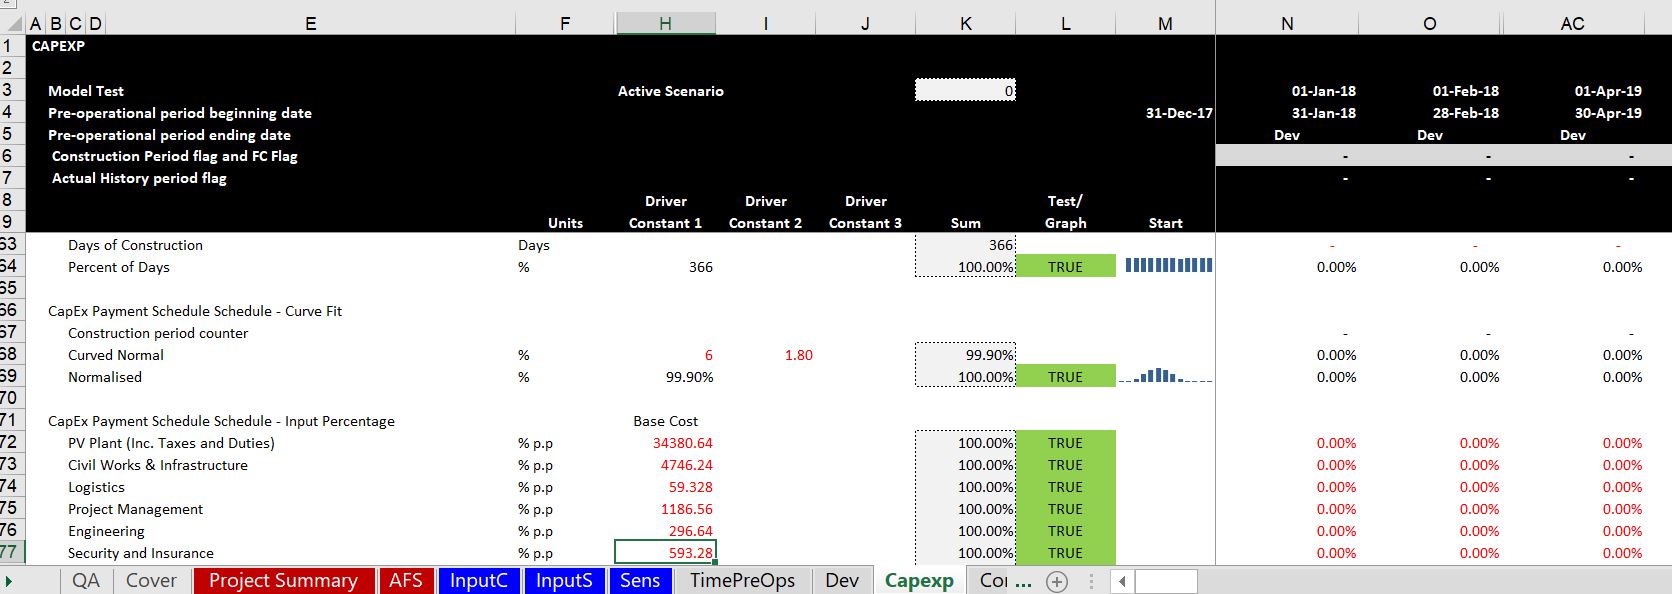
After many years, I am more and more a believer in effectively and efficiently using the columns at the left of the sheet and using colours to point out where numbers come from. It drives me crazy when people show off by very quickly pressing CNTL, 1 or some other short-cut and colour cells one by one. Indeed, I see people very proud of their mastery of colouring cells with their mac. I have made much of the generic macro program in response to this and you can go to the link to see how to use it efficiently. I suggest efficiently using the columns to the left to make your model much more transparent and easy to read and understand. Many people only present the units and the sum column. But when you put the drivers of each equation in the left column, the model becomes much more transparent. In the example below the constants come from the input sheet and I have used the generic macro sheet to demonstrate when a number comes from another sheet. Note that in this case where numbers in the left come from another sheet, they are coloured in red. This is done automatically with the generic macros file.
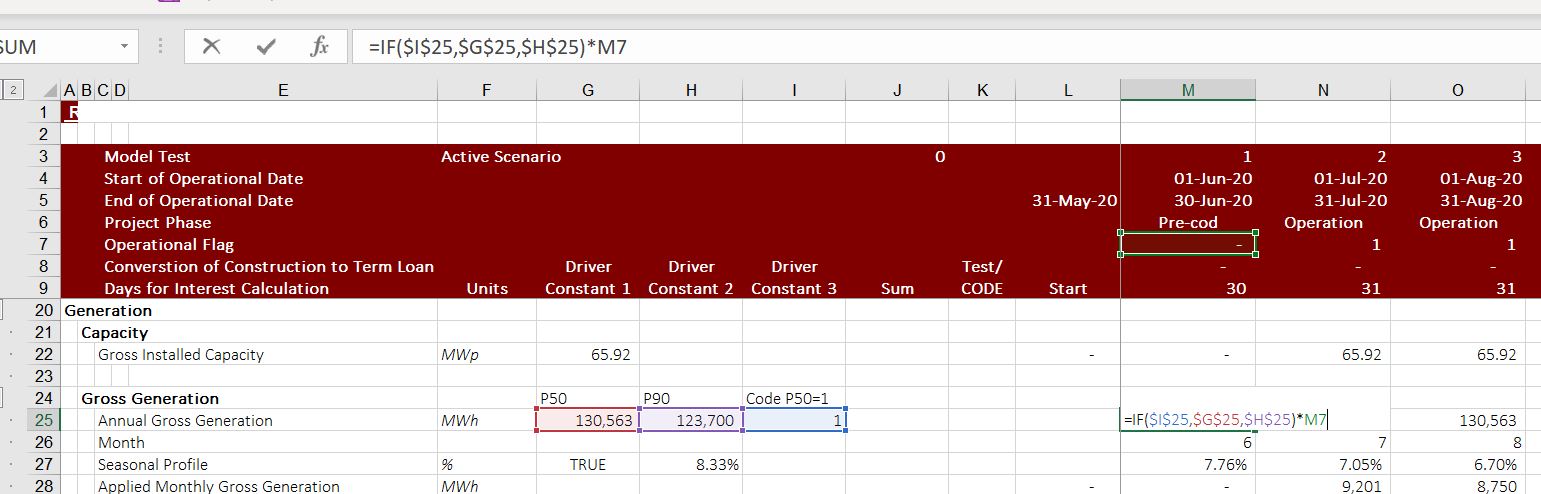
I have collected many examples of what not to do for the various formatting and excel issues. The example in the screenshot below shows what a pain it is when the drivers are not on the left. Then, if you are auditing a model to understand what is going on, you will waste a lot of time with the trace precedent. Instead, as in the second screenshot, you can out the drivers in the left columns. Now the drivers are in the left column and not included in the formula where you cannot really see what is happening. I hope you can see that it is much easier to understand what is happening in the second example where I have shown the formula.
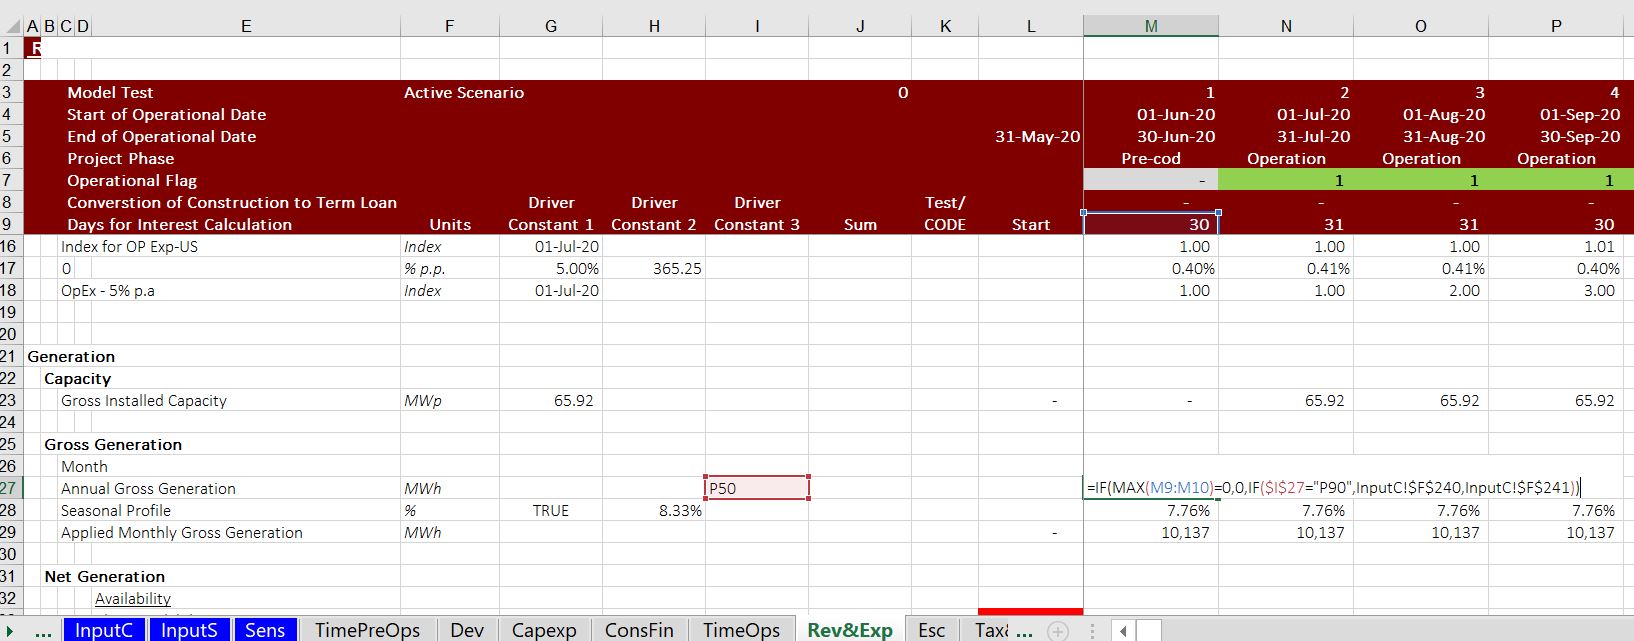
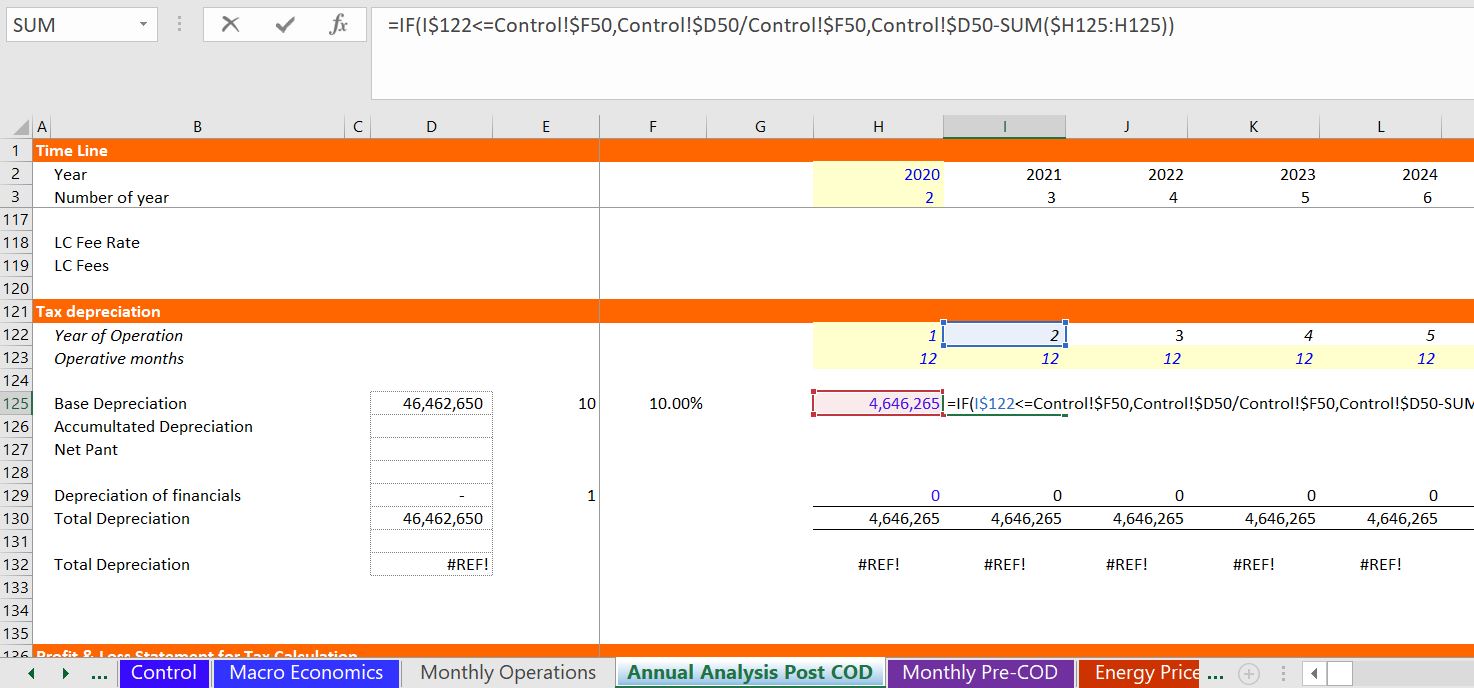
In the screenshot below, I show another another example of not putting the drivers in the left column because I am obsessive about this. The example in the screenshot below is a horrible formula where you refer to values from another sheet instead of putting the values over to the left. Clearly the Input P130 should be in the left hand columns so you can see what is going on.

Here is how you can put the sheet name at the top of each sheet
=RIGHT(@CELL(“filename”, A1), LEN(@CELL(“filename”, A1)) – SEARCH(“]”,@ CELL(“filename”, A1)))