The models and videos on this page address how to solve the painful issue of presenting monthly (or quarterly) data in separate columns and then also presenting annual totals after each year. For example, there may be detailed month by month data that is followed by an annual total. The issue is that when adding up annual totals in such a presentation, you should not change the formulas across columns. This page explains how you can use INDEX, MATCH and SUMIF to make the summation of annuals a pretty smooth process.
The explanation of how to solve the annual subtotal presentation issue is included in the file that you can download by pressing the button below. This file includes the screenshots below that walk through the different steps that involve counting with increments in a detailed month by month model, using SUMIF in a detailed model to find annual data; finding code numbers to print the data and using conditional formatting.
Timing in Corporate Models and Subtotals that Accumulate Monthly or Quarterly Data
I did not really know where to put the model that illustrates how to take monthly data and then make it into quarterly, semi-annual or annual data. The thing not to do is to manually put in sub-totals with the sum function. If you do this your model will be clumsy, in-flexible and inaccurate. Instead, you can include separate sheets that summarise the same information as in your detailed analysis, but include flexible sub-totals. You need to establish a counter with the MOD function after starting with a basic period counter. Then use the SUMIF function to add across months or quarters. Finally, use the MATCH (with zero at the end) and the INDEX to put the sheet with sub-totals together. This model demonstrates the importance of setting-up time lines in corporate finance models. The time lines are essential for history versus forecast as well as the flexible sums.
Screenshots that Illustrate the End of the Process
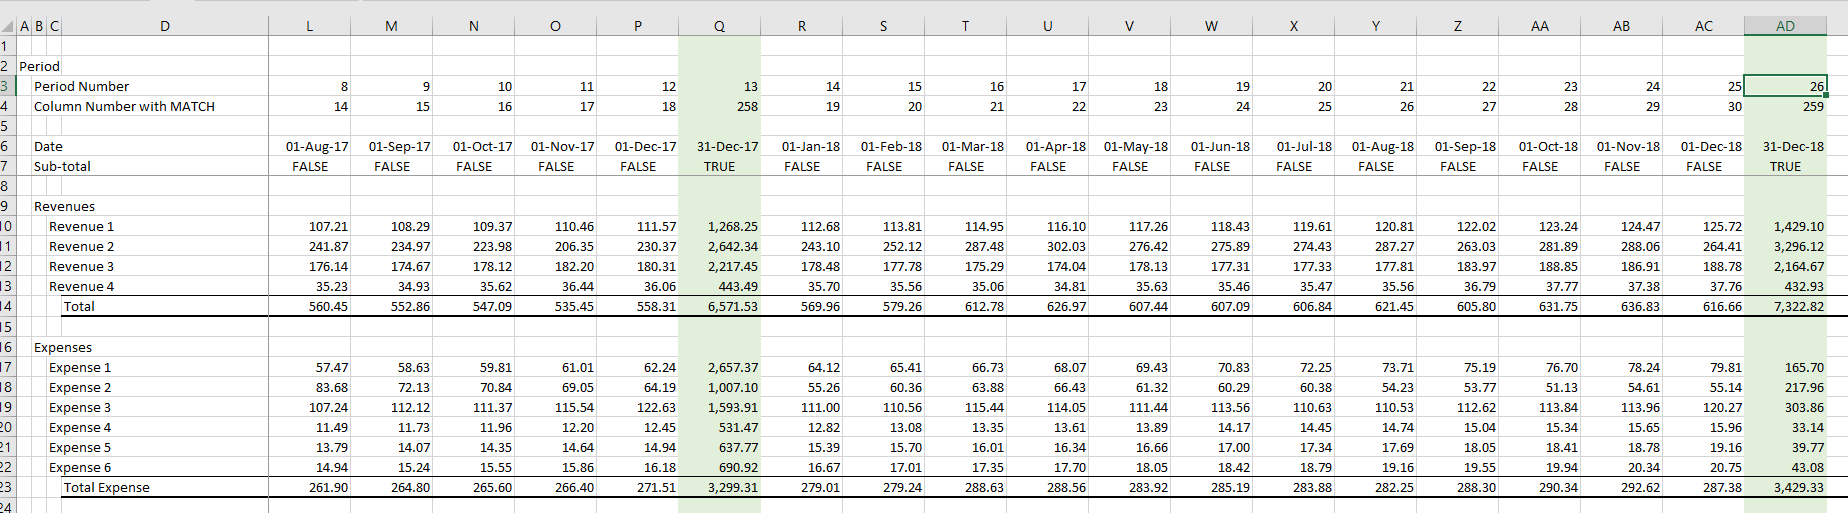
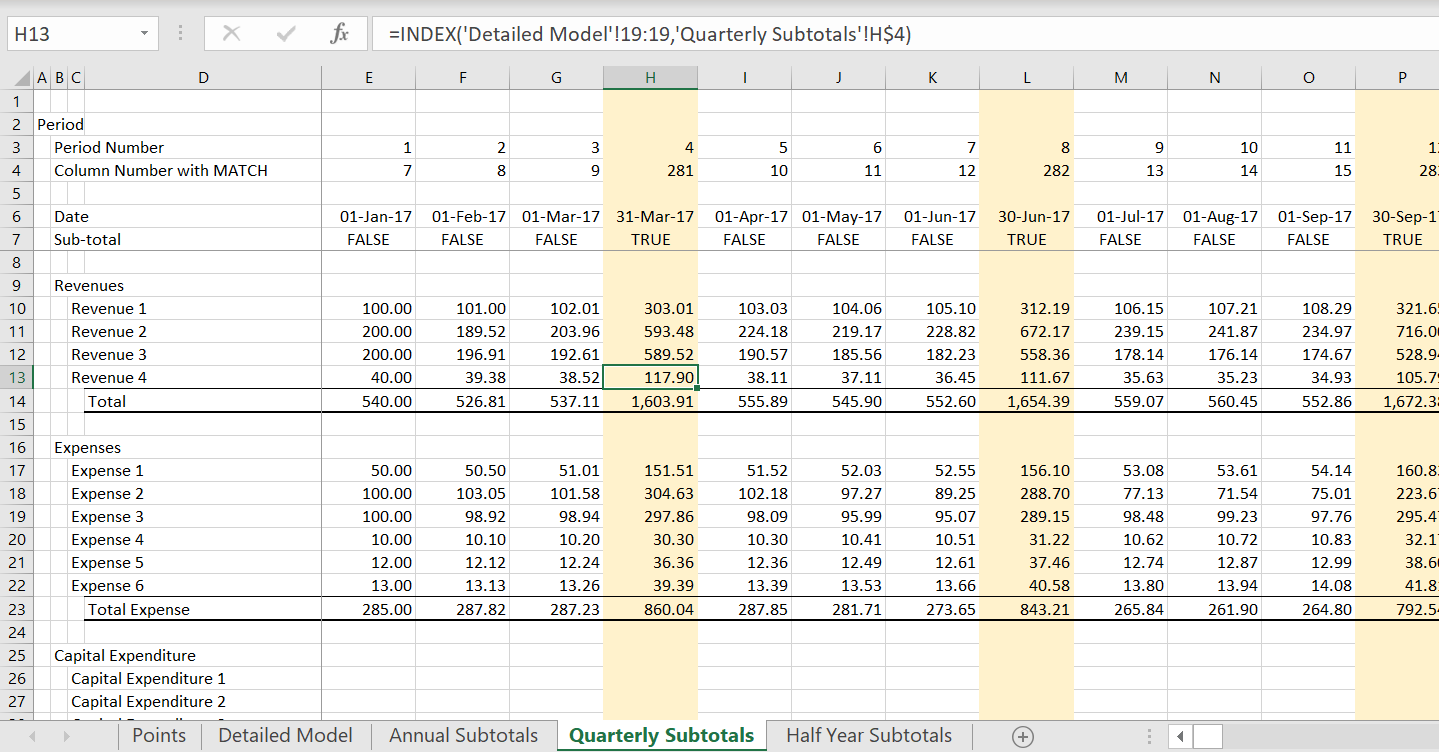
The two screenshots below illustrate what you want at the end of the process. The first screenshot shows a month by month presentation with annual data at the end of the year. The second screenshot shows monthly data with a subtotal for each quarter. I will summarise a step-by-step approach and then explain each step in detail below in separate sections. Note the period number and the column number at the top of the page. The period number is just a counter. The column number is described below and uses a MATCH function.
Step by Step Process for Creating Reporting Sheets with Summaries
I know that most of you are saying, screw this, I can do it much faster by hand with different formulas. The step by step process may seem cumbersome, but you can get used to it fast and it is really not that bad. The main point is to keep your model clean (i.e. without sub-totals) and have the same formulas in each column. That is the starting point. Then, the sheets that accumulate every 12th or 4th period are just output sheets (like summarising annual numbers in a monthly project finance model). After you have a clean monthly model with the key equations, you can do the following.
- Set-up a counter variable with EIS that counts each month.
- Use the MOD function to show a TRUE whenever the prior month number was divisible by 12 or by 4.
- Use the TRUE from above to develop a second counter that skips a number when the end of the year is reached.
- Use the SUMIF and Year counters to create annual totals at the right of the model
- Include Counters on the annual totals that begin with 13 and increment the number by 13 (or by 5 and increment by 5).
- Create an Annual Subtotal Sheet and create a simple counter; use the MATCH function with the counter that should find the column number in the detailed model including the annual summaries.
- Use the INDEX with the MATCH and create a TRUE/FALSE switch when the Annual (or quarterly) total occurs.
Clean Monthly Model
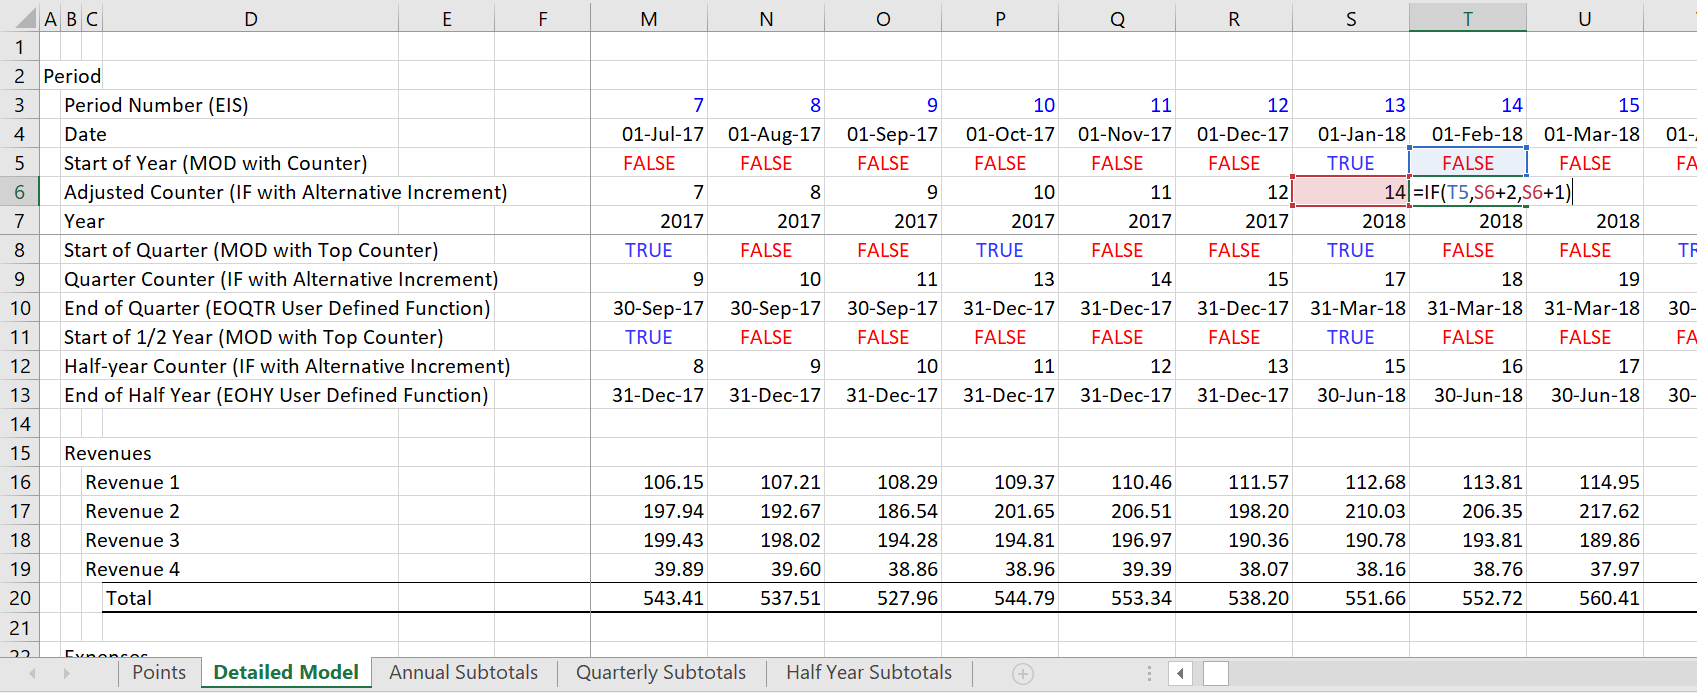
In the clean monthly model, make a counter by month as shown in the screenshot below. It is much better to keep you model clean for consistent equations and also for flexibility and also for graphing. Note the period counter in row three that is labeled with the EIS short-cut. This just counts the months. Note that the adjusted counter is skips after number 12. This skip is driven by the TRUE in row 5.

Make a Second Counter that Skips a Number After the Year is Finished
The screenshot shows the key behind this process. That is to make a second counter variable that leaves a blank row that can be used to fill in the annual numbers in a second report. To do this, first make a TRUE and FALSE switch that tests whether the prior number is divisible by 12. This true and false statement shown in the screenshot below can be used to skip a number (note in column R the number 12 skips to 14 in column S).

In the example file that you can download, I have created a report with quarterly sub-totals as well as annual sub-totals. The process is very similar except that you use a MOD with 3 instead of 12 and you skip every fourth number. The quarterly MOD function is illustrated in the screenshot below.
In the example below, the TRUE or FALSE is from the quarterly analysis using 3 months and there is a skip of the counter every third month.

The screenshot below demonstrates how you can make a formula that is different depending on whether the TRUE/FALSE switch described above is TRUE or FALSE. If the switch is TRUE meaning that you have come to the end of a year, then you can add 2 instead of 1 to the prior counter variable. This will leave a space in the reporting page when you use MATCH and INDEX. The example below shows how the counter is adjusted to skip a column after the finish of a year or a quarter.
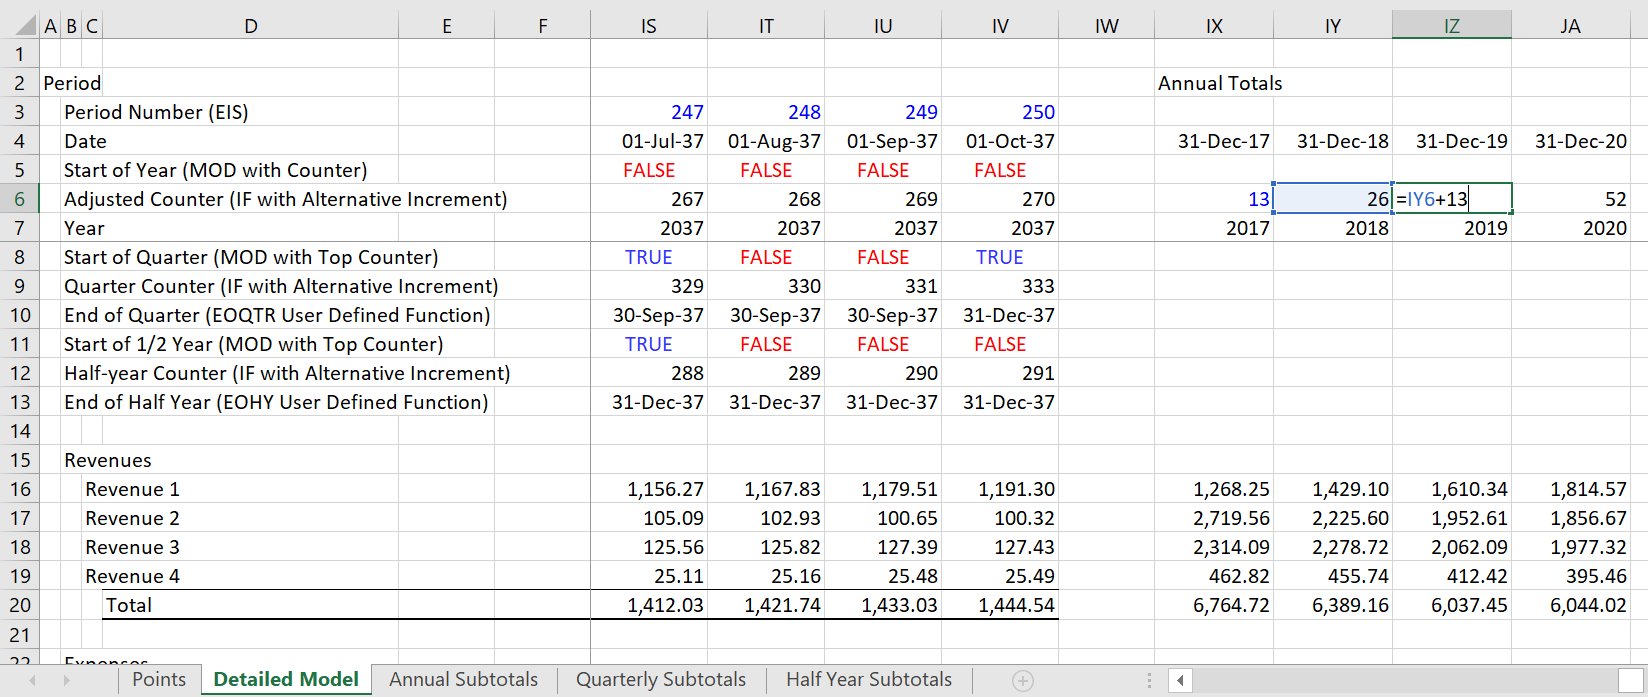
Create Annual Totals in the Detailed Model and Start with 13 or 5
You can create the year numbers the right and you can also create annual numbers using the SUMIF. To do this, put in the years below the date. With the years defined, you can use the SUMIF function. Above the years, you should put the blank number that was not used. To do this, put in the first number that was skipped and then add 13 to that number.
Use MATCH and INDEX in New Annual Report Sheet
The screenshot below demonstrates that you should use the MATCH with zero ant the end to find the correct column number from your detailed month by month model. Remember that there is a skip in the counting of the rows. The conditional formatting is derived from the TRUE/FALSE in line 7.

Conditional Formatting Sub-total Columns
The screenshot below illustrates how to use the TRUE or FALSE to make the conditional formatting. You can select the whole block of numbers and then use the New Rule and the Use a Formula. You then go to the left hand TRUE and press the F4 key a couple of times until the row but not the column is fixed.

Video Demonstrating the Annual Sub-total Process
The video below can be used together with the discussion above. It walks through the step by step process that I used above.
[wonderplugin_video iframe=”https://www.youtube.com/watch?v=eBR5JeBDC3c” videowidth=600 videoheight=400 keepaspectratio=1 videocss=”position:relative;display:block;background-color:#000;overflow:hidden;max-width:100%;margin:0 auto;” playbutton=”https://edbodmer.com/wp-content/plugins/wonderplugin-video-embed/engine/playvideo-64-64-0.png”]