This page describes how to create a excel database that scrapes data from Federal Reserve Economic Database (FRED). The approach uses the VBA code WORKBOOKS.OPEN and then some code that you can create with text to columns. I hope I have made the process as simple as possible where you just have to get the FRED code. The FRED database contains a massive amount of data on economic and financial variables and you can combine the data effectively into a master database. You may want to present the data in different ways and automatically update your presentations using the data and control different ways to use and present. You can quickly scrape data and then compare, adjust, analyse and graph data in a flexible manner by using the workbooks.open method described below. This page explains the steps of finding the FRED codes; using the Workbooks.open and text to columns to read a single series; reading multiple series using the INDEX function; summarising data using the INDIRECT function.
Very Simple A-Z Example
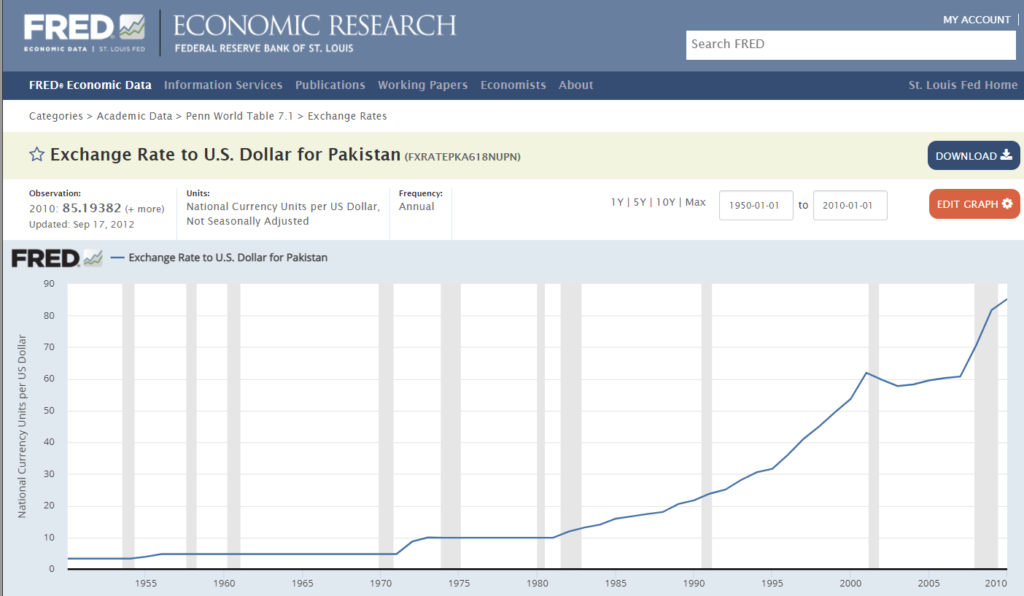
The first step of the process is to find the data you want and then copy and paste the title to a spreadsheet program. You need the code in the title of the graph. In the example below, the code is in the brackets. In this case, the code is XRNCUSPKA618NRUG.
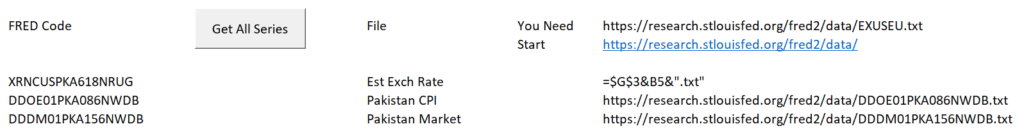
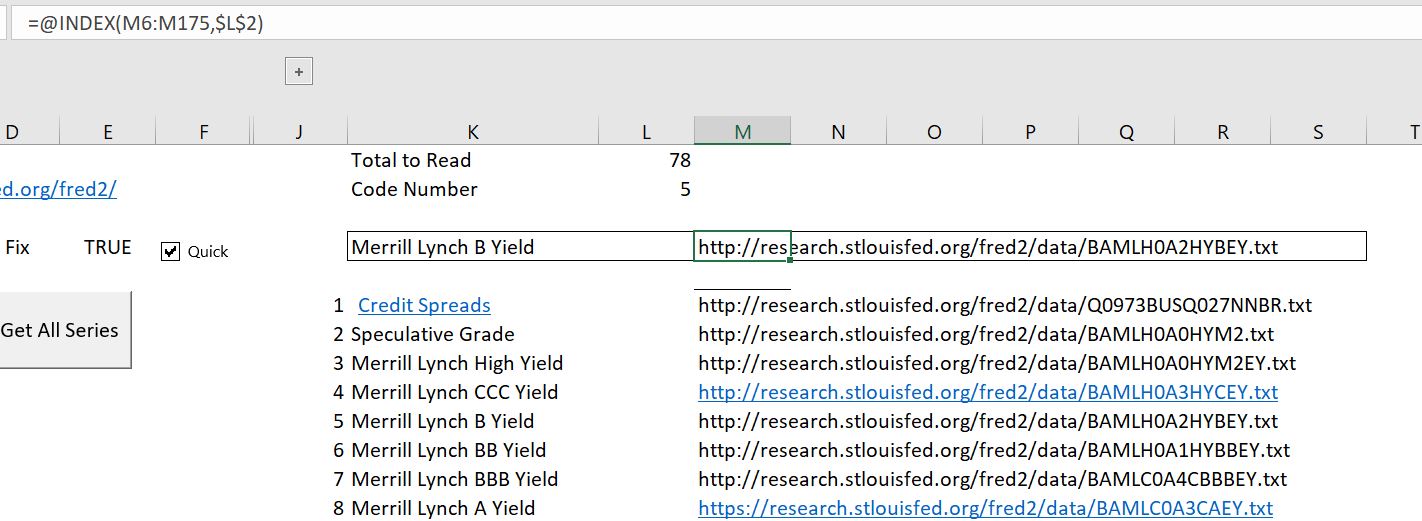
Step 2 of the process is to open the template spreadsheet and to put in the codes. You can then put together a URL with .txt to retrieve the data. The screenshot below illustrates how you can create the URL that will be used with workbooks.open. Once you have the codes established, you can use the INDEX function to select one of the URL’s. Note that the file summary name will be the sheet name when you read in the data.
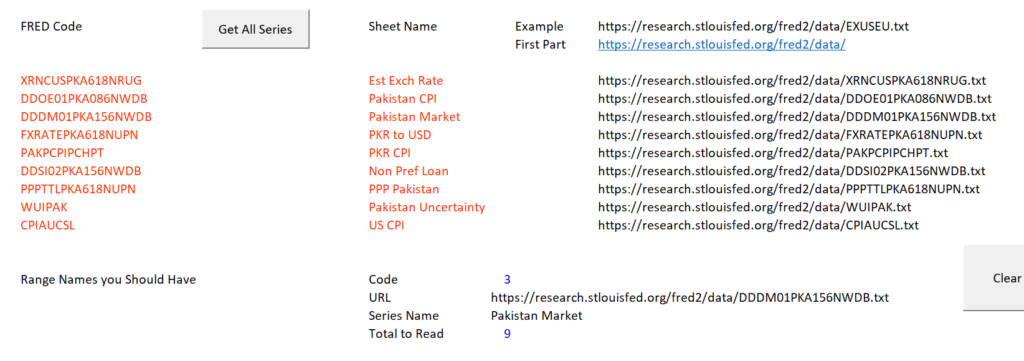
When you get all the data and enter the INDEX function, you sheet may look something like what is in the following screenshot. Note that there should be range names for the URL; for the code number used in the INDEX function; for the sheet name and for the total number of codes that you want to read.
With this data you can make a couple of simple macros. The first reads in one of the items from FRED. This is illustrated below. If you are going to copy this data to a blank sheet, make sure that the range names in your spreadsheet are consistent with the range names in the
'
' You need the following range names
' URL -- Where you are using the index
' CODE -- The index code
' Series_name -- the sheet name associated with the URL
' Total_to_read -- number of series
'
' You also should have a sheet named BREAK Sheet
'
'
' Assign the macro get_all_data
'
Sub GetData()
base_book = ActiveWorkbook.Name
base_sheet = ActiveSheet.Name
num_sheets = Sheets.Count
On Error GoTo exit1:

Workbooks.Open (Range("url"))

temp_book = ActiveWorkbook.Name
temp_sheet = ActiveSheet.Name
'
Columns("A:A").Select
Selection.TextToColumns Destination:=Range("A1"),

' This is the text to col

DataType:=xlDelimited, _
TextQualifier:=xlDoubleQuote, ConsecutiveDelimiter:=True, Tab:=True, _
Semicolon:=False, Comma:=False, Space:=True, Other:=False, FieldInfo _
:=Array(Array(1, 1), Array(2, 1), Array(3, 1), Array(4, 1), Array(5, 1), Array(6, 1), _
Array(7, 1)), TrailingMinusNumbers:=True

Sheets(temp_sheet).Copy _ after:=Workbooks(base_book).Sheets(num_sheets)

min_date = WorksheetFunction.Min(Range("A:A")) ' get min date data_row_start = WorksheetFunction.Match(min_date, Range("A:A"), 0) ' fin row number

For Row = 1 To data_row_start - 1
    For col = 2 To 20 Cells(Row, 1) = Cells(Row, 1) & " " & Cells(Row, col) Cells(Row, col) = ""
Next col
Next Row
On Error GoTo problem_reading
ActiveSheet.Name = Range("series_name")

GoTo skip2:
problem_reading:
MsgBox "problem with sheet name " & Range("series_name")
On Error GoTo 0
skip2:

Workbooks(temp_book).Close
exit1:
End Sub
The above code is for one single read of the data. The next code below reads multiple codes using the INDEX technique where you make a loop consistent with the INDEX function
Sub get_all_data()
calc_status = Application.Calculation
Application.Calculation = xlCalculationManual
Application.DisplayAlerts = False
Application.ScreenUpdating = False
base_sheet = ActiveSheet.Name
' Range("start_time") = Time
For i = 1 To Range("total_to_read")
Range("code") = i
Sheets(base_sheet).Select
ActiveSheet.Calculate
On Error Resume Next
Application.StatusBar = " Downloading " & Range("series_name") & " Series " & i & " Out of " & Range("total_to_read")

' Run the file that gets the data for a single series
GetData

Range("all_data").Cells(i, 1).Select
series_name = Range("series_name")

ActiveSheet.Hyperlinks.Add Anchor:=Selection, Address:="", SubAddress:= _ "'" & series_name & "'!A1", TextToDisplay:=sheet_name

Next i
Application.Calculation = calc_status
Application.StatusBar = False
' Range("end_time") = Time
Sheets(1).Select
End Sub
Finally, you can create a clear sheet macro that removes the sheets after the BREAK page. This works with a loop that starts at the back and then moves forward until the BREAK sheet is reached.
Sub clear_sheets() calc_status = Application.Calculation Application.Calculation = xlCalculationManual Application.DisplayAlerts = False For i = Sheets.Count To 1 Step -1If Sheets(i).Name = "BREAK" ThenApplication.Calculation = calc_statusExit SubEnd IfSheets(i).DeleteNext i Application.Calculation = calc_status End Sub
Types of Data in Fred
In the old days, you could read data into text files in the FRED database. The text files were available via a link and could easily be read into excel with text to columns tools. While the text files are no longer there, you can still read the data. The only problem is that it is a bit more difficult to find the URL names. Essentially, you must add the name .TXT the URL’s. Luckily, I retained files with the URL’s which have the following form. Note that this URL is different from the other URL’s that you may try to copy. For example, the components /fred2/data/ are not in the URL’s to get the data directly to excel. To find different series, you just have to get the codes and put the .txt at the end.
To find the codes, just go to FRED and look up things like interest rates, commodity prices or economic series. Then you can find the codes by looking at the URL associated with a graph. Once you have the code, you can get the data. In some cases you can try to modify the codes as with country by country data. In other cases, you can just create a list of URL’s with different codes as illustrated below. I created this list by looking up at each URL. You can then use the INDEX function with a code number to read each of the URL’s and put them into a different sheet. You can find this interest rate file on the associated web page http://edbodmer.com/interest-rate-analysis-from-fred/
Using the Workbooks.open and Text to Columns to Read a Single Series
In this section I explain how to read a single series. The steps in doing this are first to use the WORKBOOKS.OPEN statement in VBA. In the code below, the Then you can go to the file that is read in and record a macro when you are using the text to columns tool in excel. After that, you can do some work in moving the file back to the master database and then naming the sheet. It can be a pin to go back to the project and then close the file. These steps are illustrated in the code below. The statement Workbooks.Open (Range(“econ_url”)) reads the kind of URL discussed above the .TXT. After the text file is read into excel, you can separate the variables into different columns. This is shown
.
Sub GetData()
base_book = ActiveWorkbook.Name
base_sheet = ActiveSheet.Name
num_sheets = Sheets.Count
On Error GoTo exit1:
Workbooks.Open (Range("econ_url"))
temp_book = ActiveWorkbook.Name
temp_sheet = ActiveSheet.Name
'
Columns("A:A").Select
Selection.TextToColumns Destination:=Range("A1"), DataType:=xlDelimited, _
TextQualifier:=xlDoubleQuote, ConsecutiveDelimiter:=True, Tab:=True, _
Semicolon:=False, Comma:=False, Space:=True, Other:=False, FieldInfo _
:=Array(Array(1, 1), Array(2, 1), Array(3, 1), Array(4, 1), Array(5, 1), Array(6, 1), _
Array(7, 1)), TrailingMinusNumbers:=True
Sheets(temp_sheet).Copy after:=Workbooks(base_book).Sheets(num_sheets)
If Range("quick_read") = False Then
min_date = WorksheetFunction.Min(Range("A:A")) ' get min date
data_row_start = WorksheetFunction.Match(min_date, Range("A:A"), 0) ' fin row number
For Row = 1 To data_row_start - 1
For col = 2 To 20
Cells(Row, 1) = Cells(Row, 1) & " " & Cells(Row, col)
Cells(Row, col) = ""
Next col
Next Row
End If
On Error GoTo problem_reading
ActiveSheet.Name = Range("series_name")
GoTo skip2:
problem_reading:
MsgBox "problem with sheet name " & Range("series_name")
On Error GoTo 0
skip2:
Workbooks(temp_book).Close
exit1:
End Sub
Reading Multiple Series using the INDEX Function
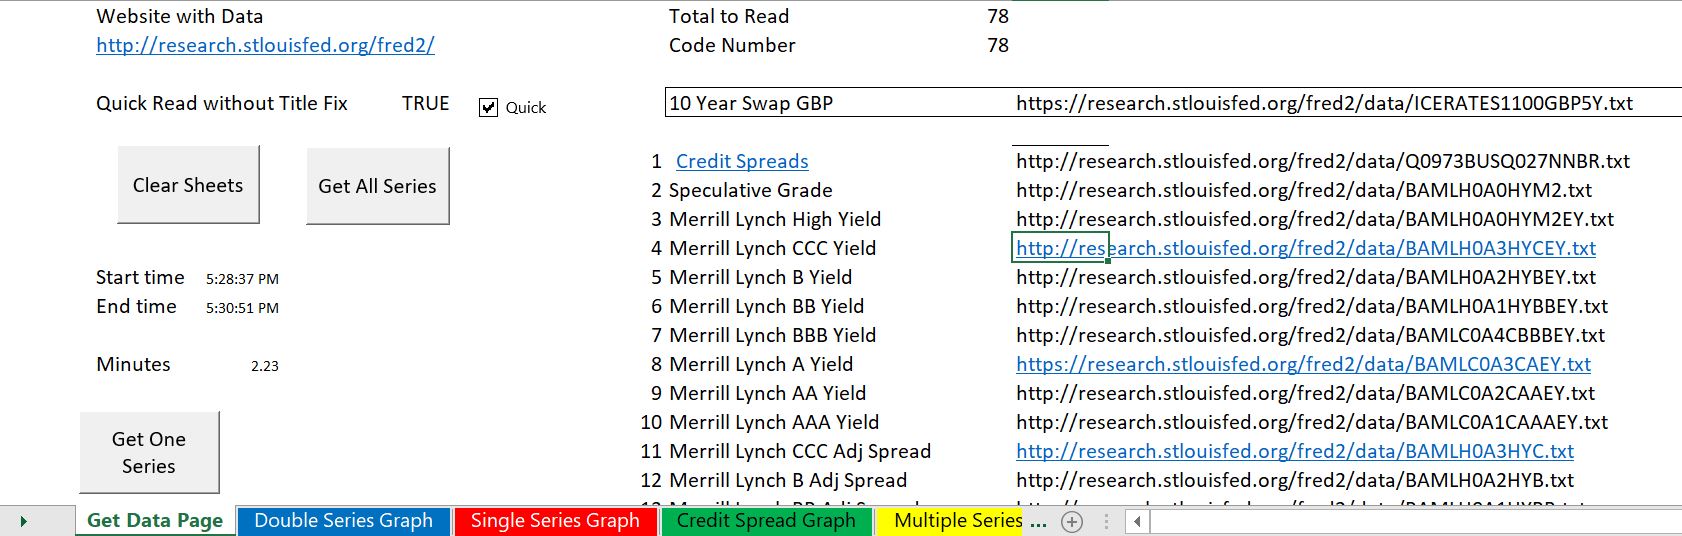
Once you have read in a single series and make sure that it works, you can read in multiple series. You just have to co-ordinate the INDEX function in excel with a basic loop in VBA. The key is to change the index code number (defined with a range name), with the counter in the loop in the VBA code. This illustrates why the INDEX function is so useful, as it is corresponds to a loop where you can do multiple things. This routine takes the names that are associated with each URL as shown in the first screenshot above and uses those name for the sheet name. Note that you have to go back to the sheet with the URL list and the INDEX function each time you go around. The key is to use the FOR NEXT loop to change the index code.
.
Sub get_all_data()
calc_status = Application.Calculation
Application.Calculation = xlCalculationManual
Application.DisplayAlerts = False
Application.ScreenUpdating = False
base_sheet = ActiveSheet.Name
Range("start_time") = Time
For i = 1 To Range("total_to_read")
Range("code") = i ' Assign the index code number in excel to the loop counter
Sheets(base_sheet).Select
ActiveSheet.Calculate
On Error Resume Next
Application.StatusBar = " Downloading " & Range("series_name") & " Series " & i & " Out of " & Range("total_to_read")
GetData ' Run the file that gets the data for a single series
Range("all_data").Cells(i, 1).Select
series_name = Range("series_name")
ActiveSheet.Hyperlinks.Add Anchor:=Selection, Address:="", SubAddress:= _
"'" & series_name & "'!A1", TextToDisplay:=sheet_name
Next i
Application.Calculation = calc_status
Application.StatusBar = False
Range("end_time") = Time
Sheets(1).Select
End Sub
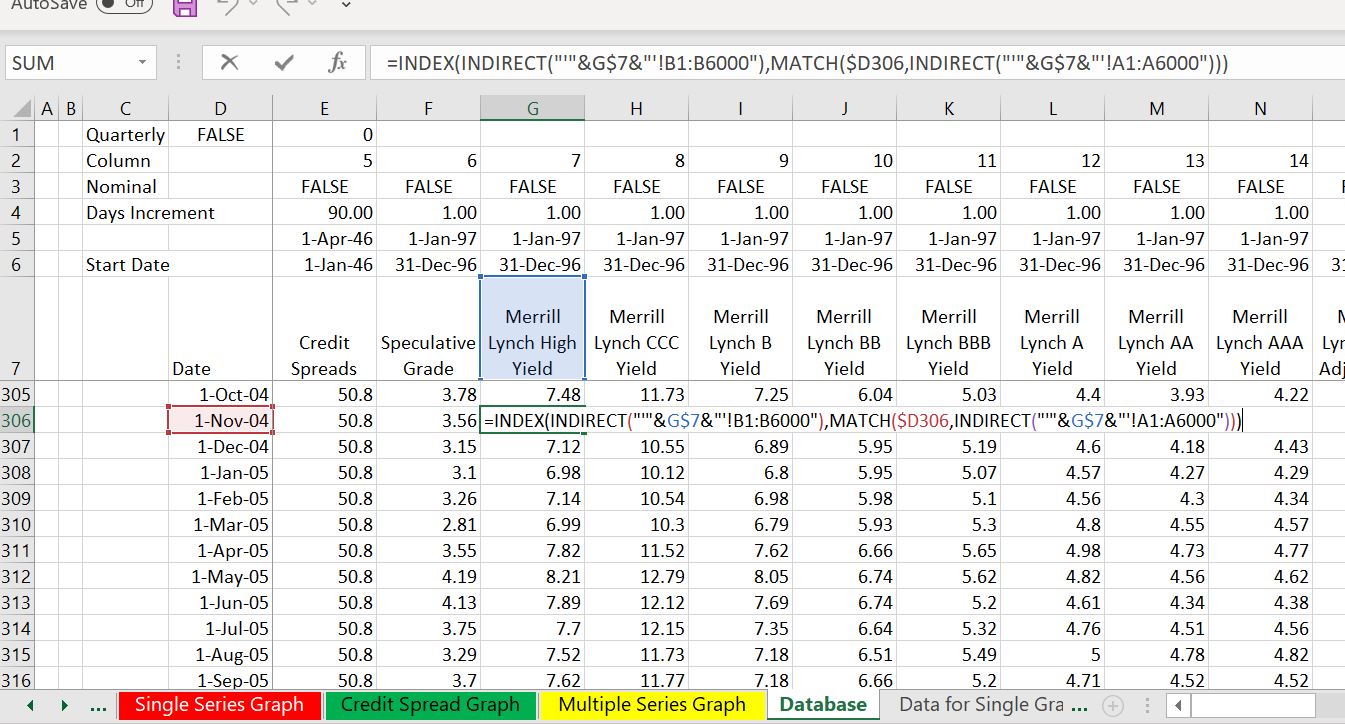
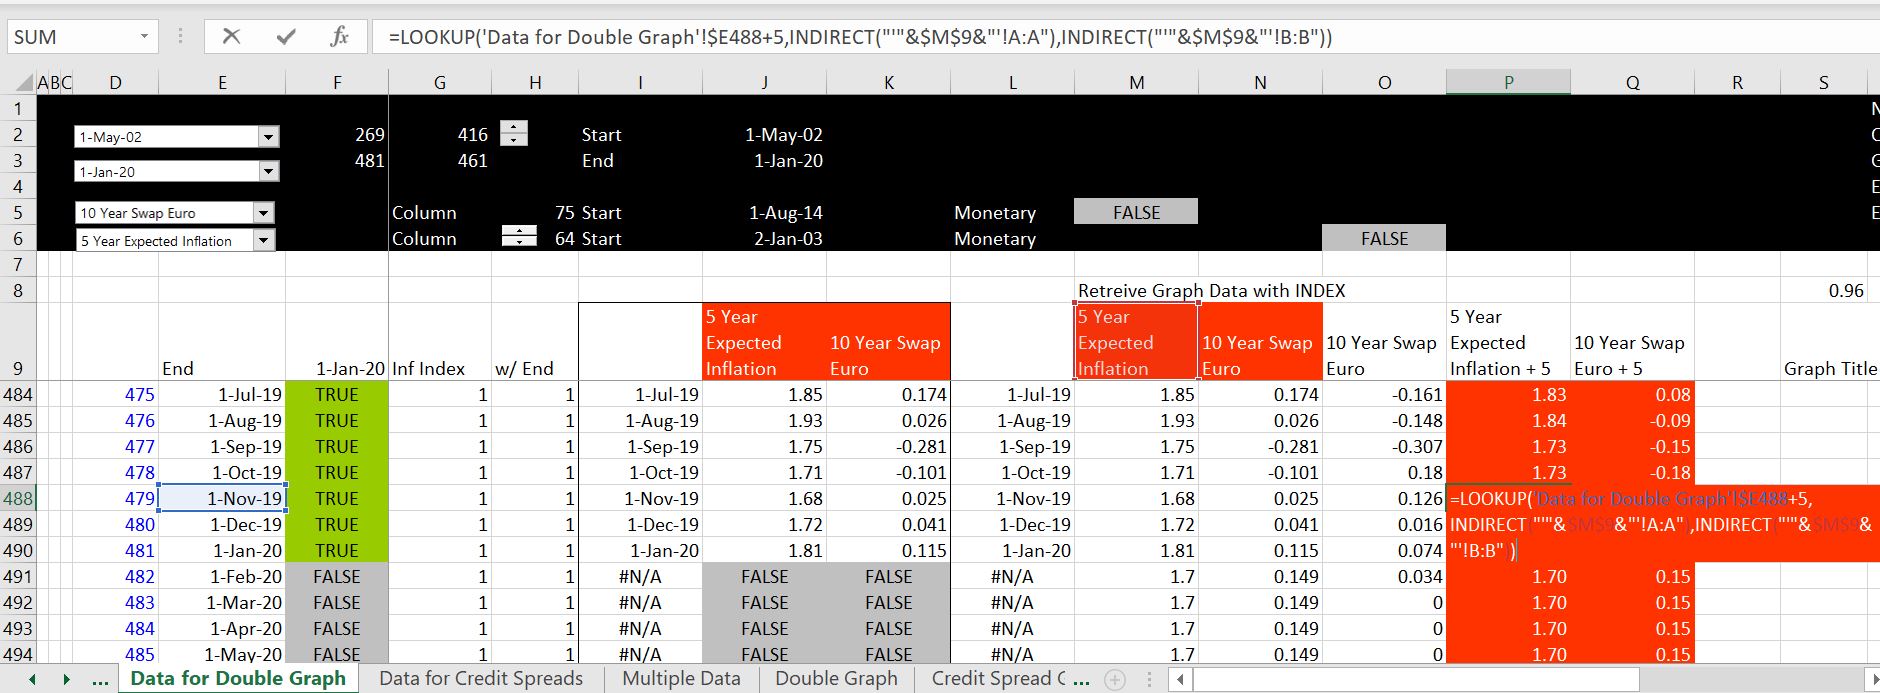
Summarising Data using the INDIRECT Function
After reading the data into separate sheets you have a file with a whole bunch of different sheets. With these sheets, you can then try and put the data into a comprehensive database. The key to doing this is the use the INDIRECT function with either LOOKUP or MATCH and INDEX. The big trick is to use the sheet names which are defined in the place where you have put in your URL list. Once you have the sheet names, you can write down your LOOKUP function by going to the sheet. After doing this, you have to replace a lot of things with “‘” and the & symbol. Using the INDIRECT function and using the LOOKUP function is illustrated in the two screenshots below.
1. Interest Rates: A few years ago you had to pay a lot for interest rate data from sources like Bloomberg. Now you can get very good historic data from the St. Louis Fed. This includes all sorts of interest rate maturities, swap rates, credit spreads and credit spreads from different countries. There are a couple of examples of downloading interest rates from the St. Louis Fed and the Federal Reserve Economic Database (FRED) below.
2. Exchange Rates: Exchange rate data is important for many reasons. For example, in acquiring stock price data, the data is generally expressed in terms of local prices; you probably want a common currency to compare the stock indicies. Finding historic exchange rates for countries such as the Philippines can be tricky and are not reported by the St. Louis Fed. To get the prices there are some alternatives one of which is http://www.x-rates.com/historical/?from=USD&amount=1&date=
3. Commodity Prices: Commodity prices can be very volatile, have mean reversion. Sources for acquiring data include the world bank and futures markets. The world bank website includes nice monthly data on many variables (except diesel prices, petrochemical prices and other prices that are from refined products). Electricity commodity prices are included on a separate page. The futures data is downloaded from:http://www.cmegroup.com/trading/energy/crude-oil/brent-crude-oil.html. The website for the world bank for the historic monthly data is below:
http://pubdocs.worldbank.org/en/561011486076393416/CMO-Historical-Data-Monthly.xlsx.
Clearing Sheets with a Backwards FOR Loop and a BREAK Sheet
An important part of this method is to be able to delete sheets and then re-read the sheets. The whole process should not take much time. To do this, you can create a BREAK sheet or use some other name. Then you can delete all of the sheets after the break sheet. The key to doing this is to create a FOR NEXT loop that starts at the end and then goes backwards using the STEP -1 after the FOR NEXT. You then go from the end backwards and stop when you have hit the BREAK sheet.
.
Sub clear_sheets()
calc_status = Application.Calculation
Application.Calculation = xlCalculationManual
Application.DisplayAlerts = False
For i = Sheets.Count To 1 Step -1
If Sheets(i).Name = "BREAK" Then
Application.Calculation = calc_status
Exit Sub
End If

Sheets(i).Delete

Next i
Application.Calculation = calc_status
End Sub