This page demonstrates how to combine scenario analysis with sensitivity and tornado diagrams to evaluate alternative contract structuring and risk analysis in a corporate model or in a project finance model. The method I suggest allows you to create sensitivity factors with spinner forms or combo boxes for individual variables such as construction costs and interest rates. At the same time, you can change overall scenarios and re-set data that was changed with the spinner buttons. By using a combination of spinner boxes and scenario analysis you can create a diagram that could be used to negotiate contract terms and the debt structure. The method extends the basis code number and INDEX function method that is discussed on the page attached to this link. When making any scenario analysis, I strongly advocate not mucking up the input page, but rather putting all of the time series variables that have sensitivity as well as scalar variables that have sensitivity into the separate sensitivity sheet.
In making the scenario and sensitivity flexible, I suggest applying two sets of range names to each variable. The first range name is assigned to variables that are computed from the standard INDEX/code number method. But the values from this method are not applied to the model inputs. Instead, the INDEX/code number data is copied to a second set of range names that are then linked to the inputs and drive the model. This second set of variables with assigned range names that are copied from the INDEX/code number variables are copied as values with VBA code and the fixed values can be in turn be adjusted with spinner boxes and/or combo boxes. A file with a simple project finance model that demonstrates this method is illustrated below.
The video below walks through how to create diagrams like the ones shown above with both spinner boxes and with scenarios.
[wonderplugin_video iframe=”https://www.youtube.com/watch?v=ZzxxTtuOCH4″ videowidth=600 videoheight=400 keepaspectratio=1 videocss=”position:relative;display:block;background-color:#000;overflow:hidden;max-width:100%;margin:0 auto;” playbutton=”https://edbodmer.com/wp-content/plugins/wonderplugin-video-embed/engine/playvideo-64-64-0.png”]
This is a video using the same method to create a tornado diagram
[wonderplugin_video iframe=”https://www.youtube.com/watch?v=rM0hpCRi9H8″ videowidth=600 videoheight=400 keepaspectratio=1 videocss=”position:relative;display:block;background-color:#000;overflow:hidden;max-width:100%;margin:0 auto;” playbutton=”https://edbodmer.com/wp-content/plugins/wonderplugin-video-embed/engine/playvideo-64-64-0.png”]
Examples of Diagrams with Flexible Sensitivity/Scenario Analysis
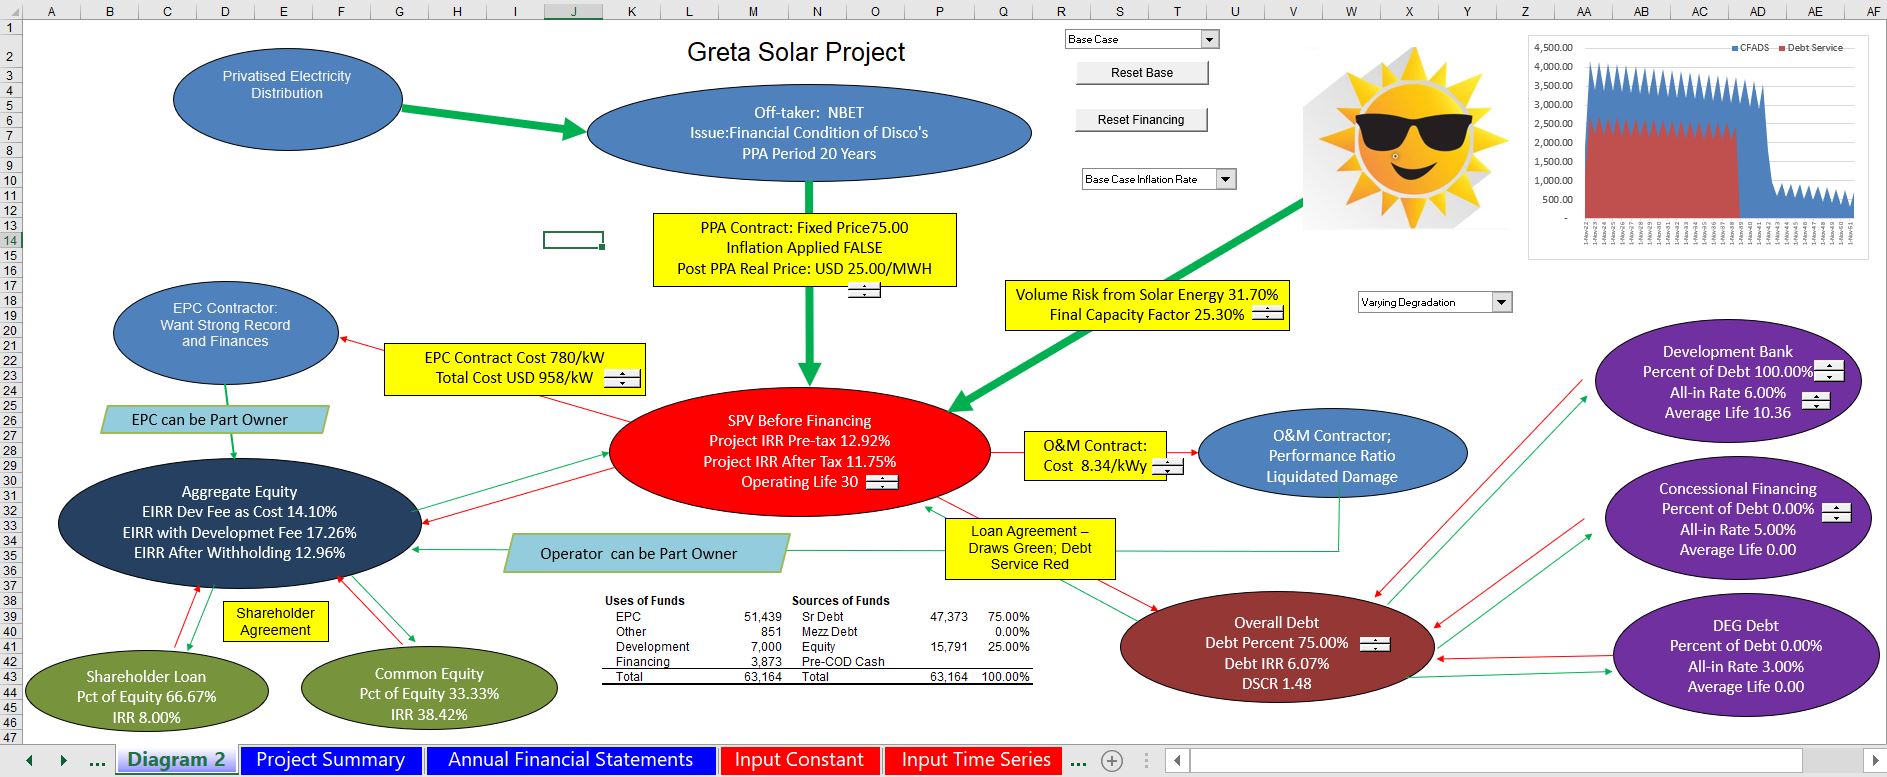
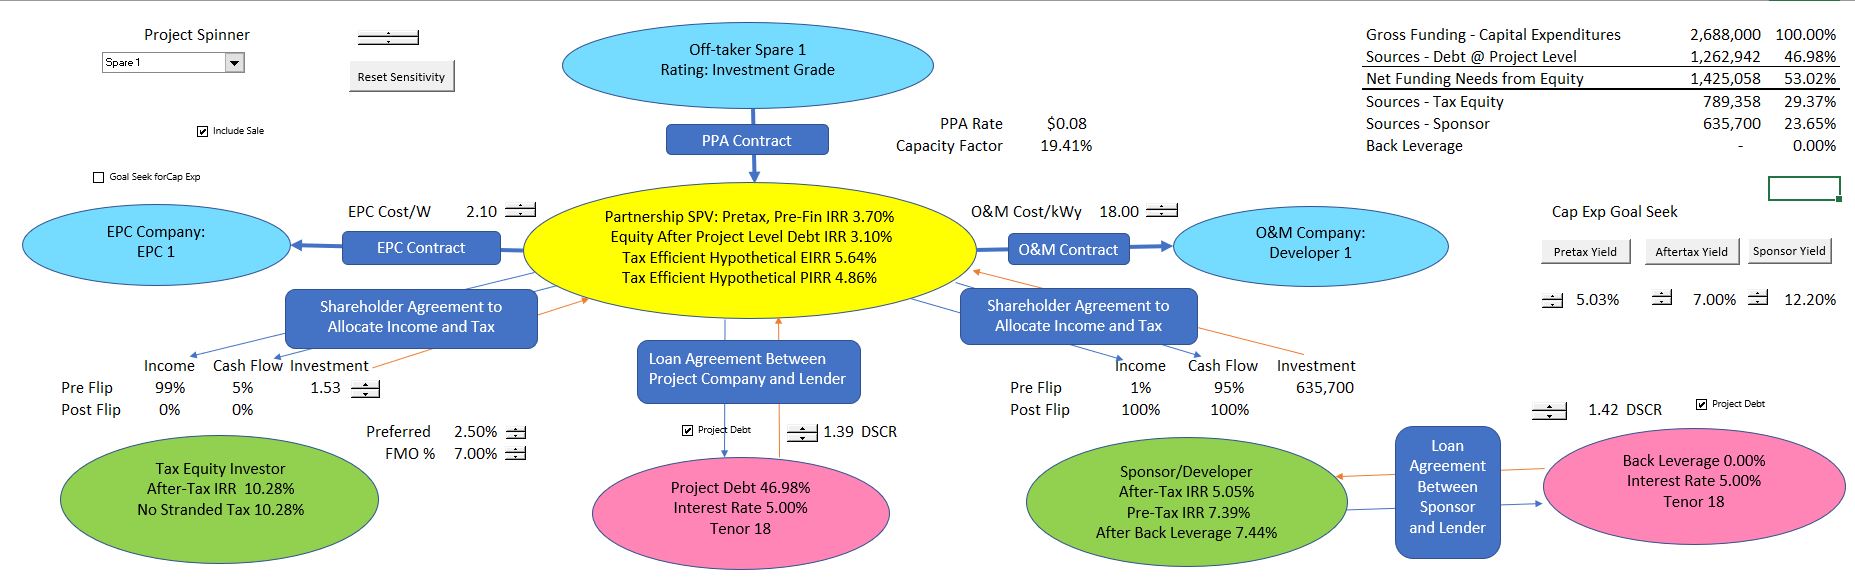
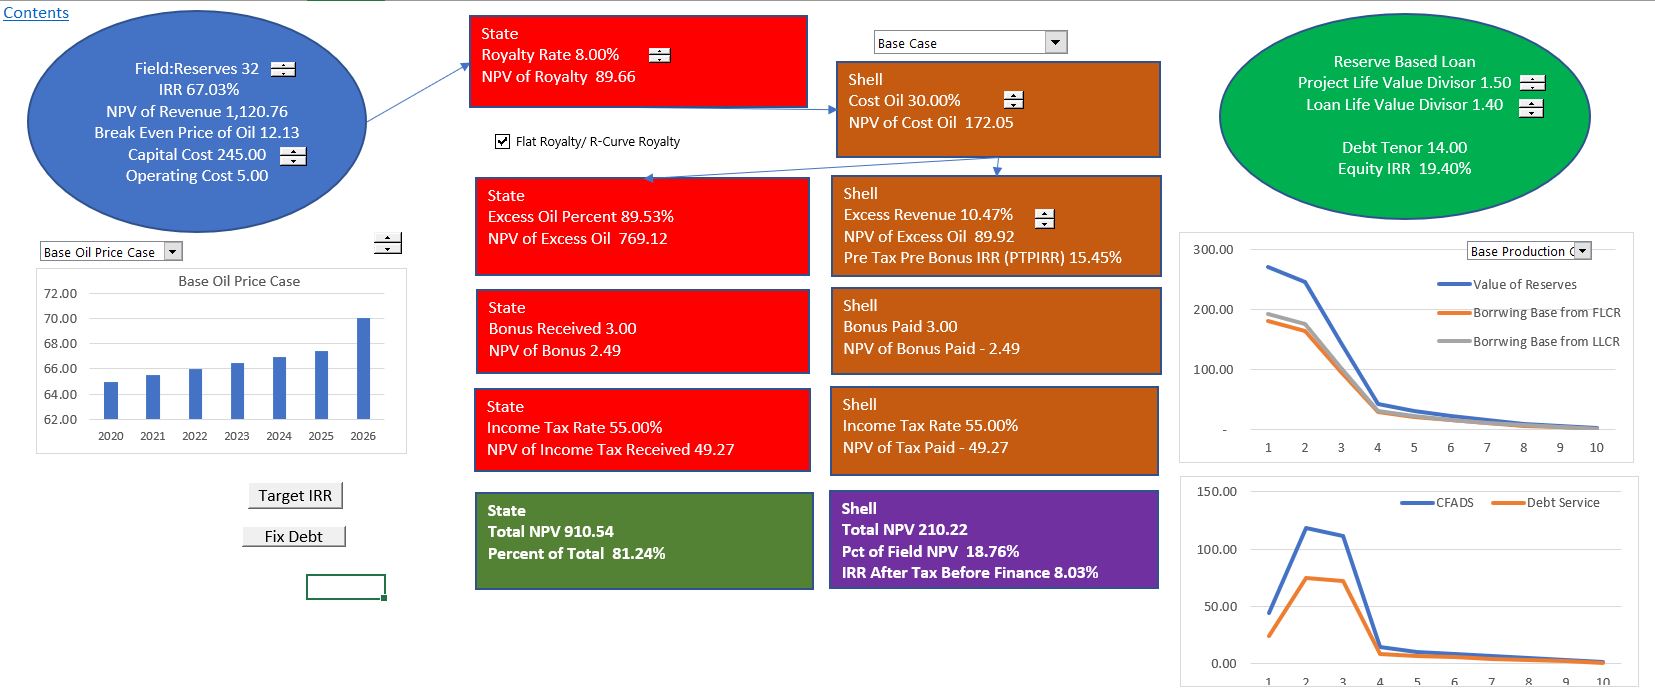
An illustration of this concept is shown in the multiple screenshots below. The first screenshot illustrates a simple Independent Power Project example with different structured penalties that is taken from the file attached to the button above. The file that has the model which contains the techniques to create spinner boxes. The second screenshot illustrates the use of spinner boxes and scenarios in the context of a much more detailed solar model that contains multiple debt issues, circular reference problems and sculpting. The third and fourth screenshots demonstrate the spinner and scenario method in the context of tax equity in the U.S. and reserved base lending.
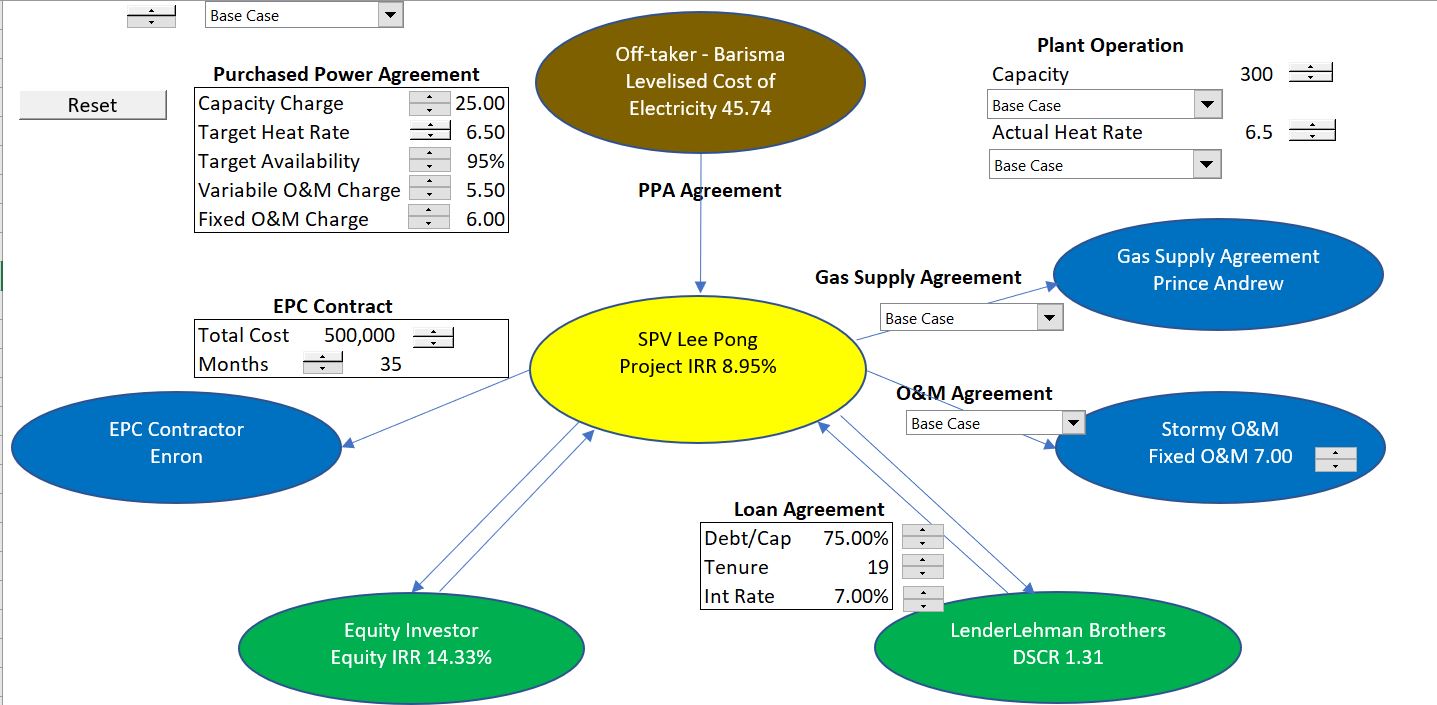
The second screenshot below illustrates a diagram for a traditional project finance transaction. It is can be used to illustrate the key contract terms as well as the risks that are not mitigated through a contract (the picture of Mr. Sun who did not sign a contract). The use of spinner boxes allow you to change aspects of each contract including the loan agreement and evaluate the effect on alternative parties. You can also change the overall scenario and re-set the financing assumptions. When you change the overall scenario, all the data that is adjusted with the spinner boxes is reset to the case that you select. With the diagram, you can also show the effects of investors retaining profit from being the off-taker to different activities such as the O&M contract or the EPC contract.
The third example is from a U.S. tax equity. The idea of this diagram is to be able to examine the distribution to different partners with alternative transaction structures. For example, you can change the contribution ratio for the tax investor and evaluate how this affects the returns to the other parties. You can also click the box for the project debt to switch between project debt and back leverage.
The forth example illustrates how you can use the flexible scenario approach to demonstrate the numerous contract provisions that go into reserve based lending and production payment agreements. The left hand column shows proceeds to the state and the second column illustrates the proceeds to the investor. The final column on the right illustrates some of the reserve based loan provisions. The blue balloon on the left demonstrates economics of the production field.
Mechanics of Creating Flexible Sensitivity/Scenario Analysis
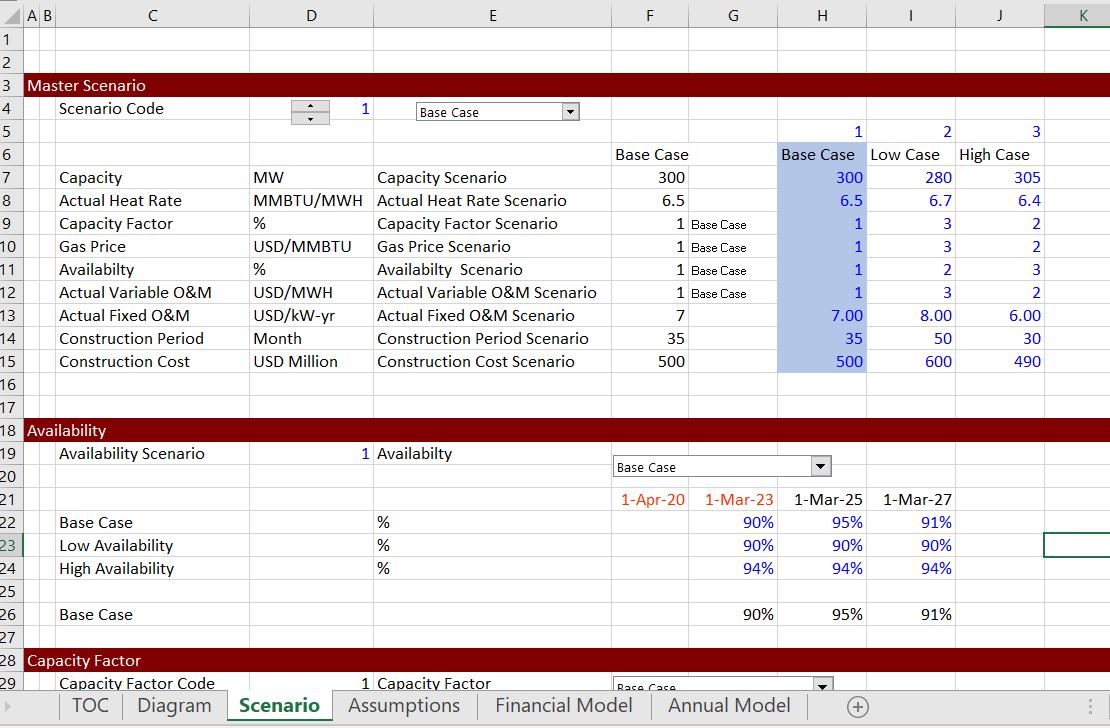
The remainder of this web page illustrates how to create these diagrams with the spinner boxes and scenario analysis. To begin the analysis that allows this kind of spinner boxes combined with scenario analysis you can start with standard scenario analysis using a code number and the INDEX function. Once you have made a little scenario analysis you should assign the range names. The first screenshot below illustrates the fundamental INDEX/code number method. Column E includes the range name list that is simply the variable in column C appended with the name scenario (use double inverted quotes and the & character). I included a bit of conditional formatting with in the scenario box as well.
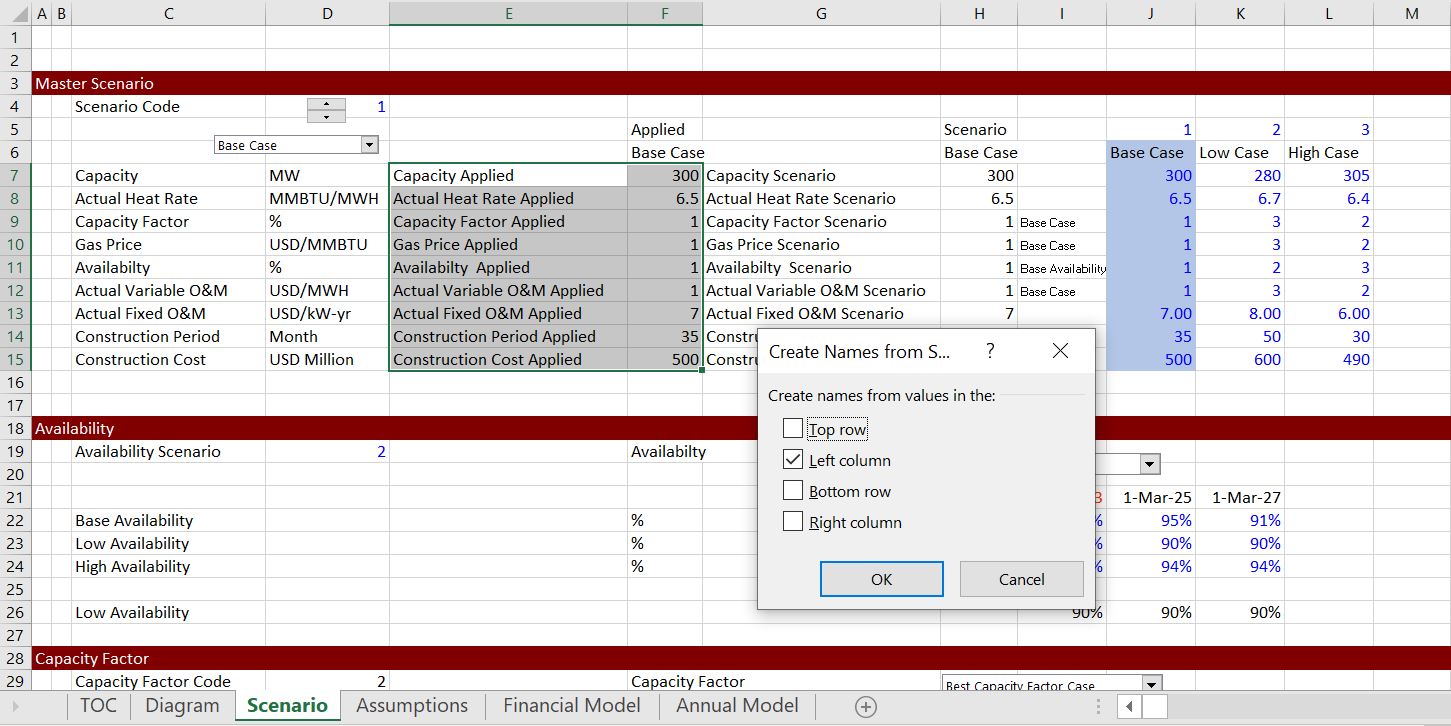
Once you have made the standard scenario table with INDEX/code number, you can add a second column with the applied variables. The numbers in this column will be copied from the scenario column with very simple VBA code. There is a different range name in column E and SHIFT, CNTL, F3 is used to assign the range names. A very simple macro can be assigned to the drop down box with the scenario code in order to plop the scenario numbers into the applied case. Note that you can also put the applied variable range names directly into the input sheet. The video below does not use the applied column but instead assigns variables in the input sheet and puts the range names in that sheet.
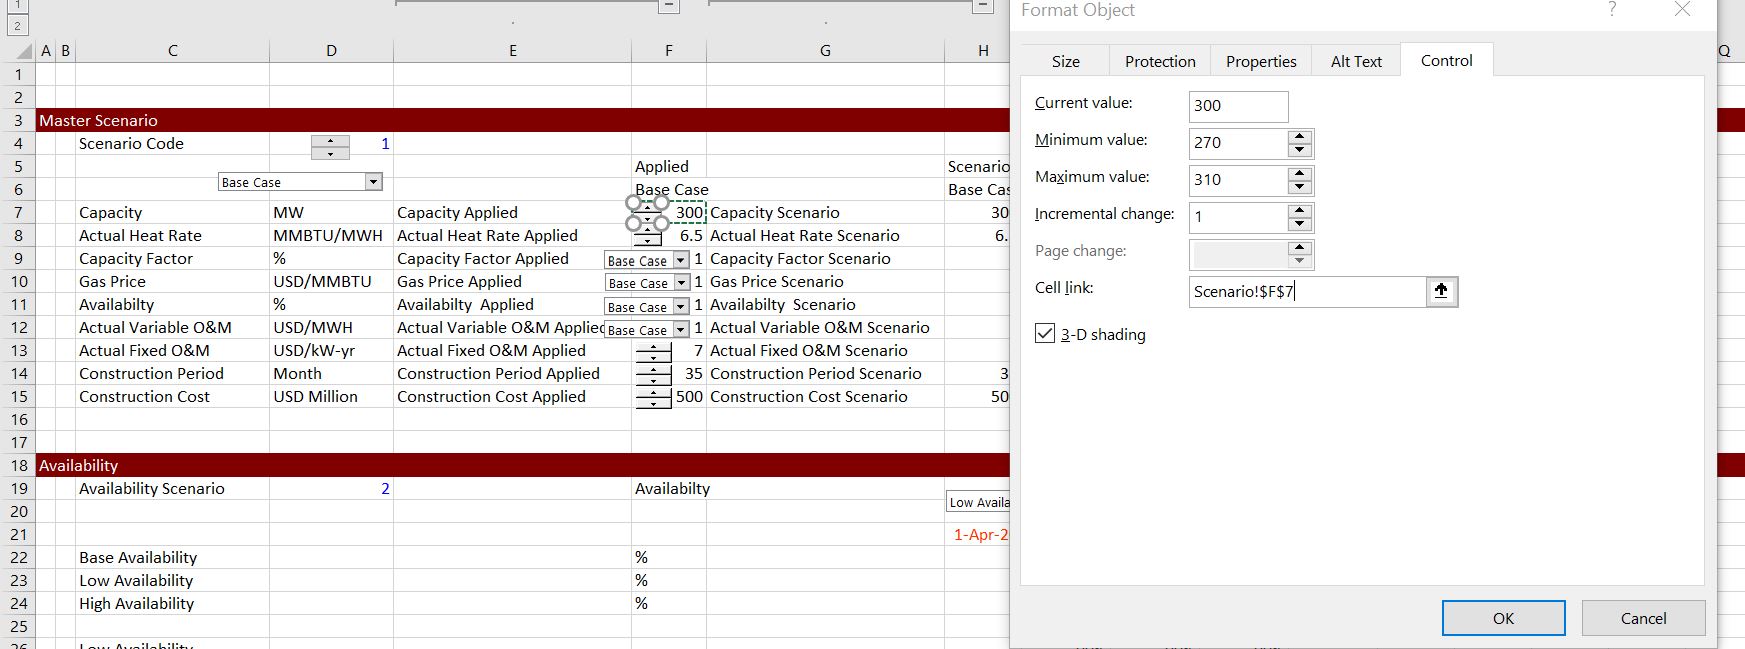
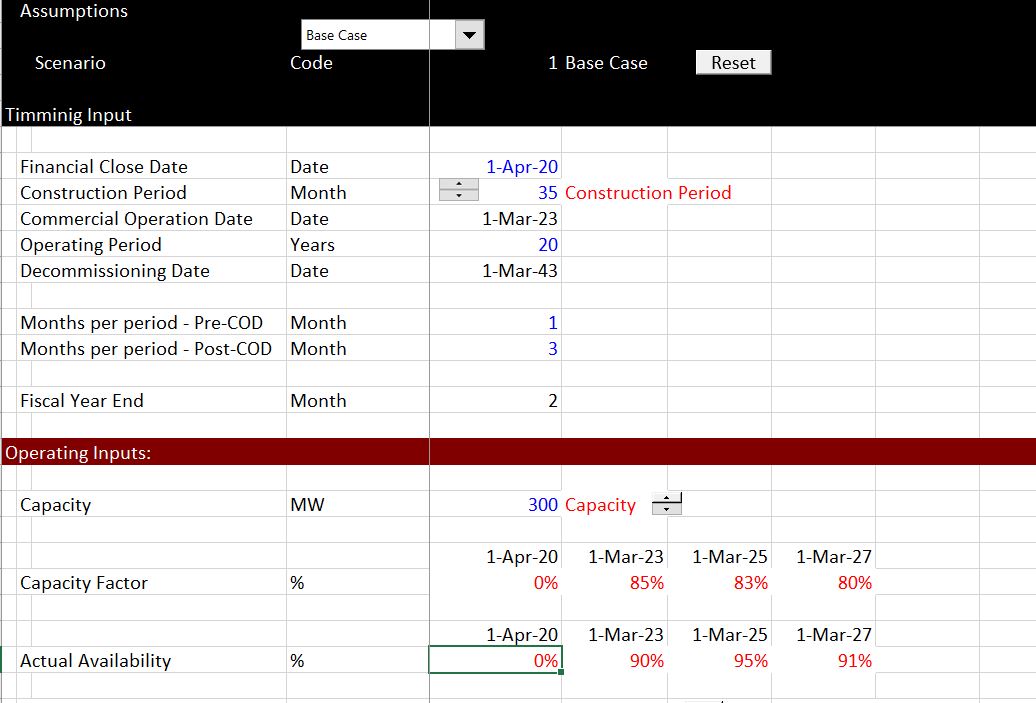
Once you have the applied column defined, you can link spinner boxes can combo boxes to this column. The process is to compute values from the INDEX function and then copy that data to the applied column. After the data is copied, you can change the data with the spinners and combo boxes. But then you can reset the data back to the applied column through running the VBA code that is illustrated below. The process of adding a spinner box to the first variable is illustrated in the screenshot below. As usual, I have used the windscreen method to assure that the cell link includes the sheet name. You can find more on the windscreen method by going to the page that is linked to this sentence. In the example with the screenshot below, the time series variables have a code number and the time series scenarios are defined in the scenario sheet. The applied code number is linked to the scenario definition as illustrated in lines 19 to 23 in the screenshot.
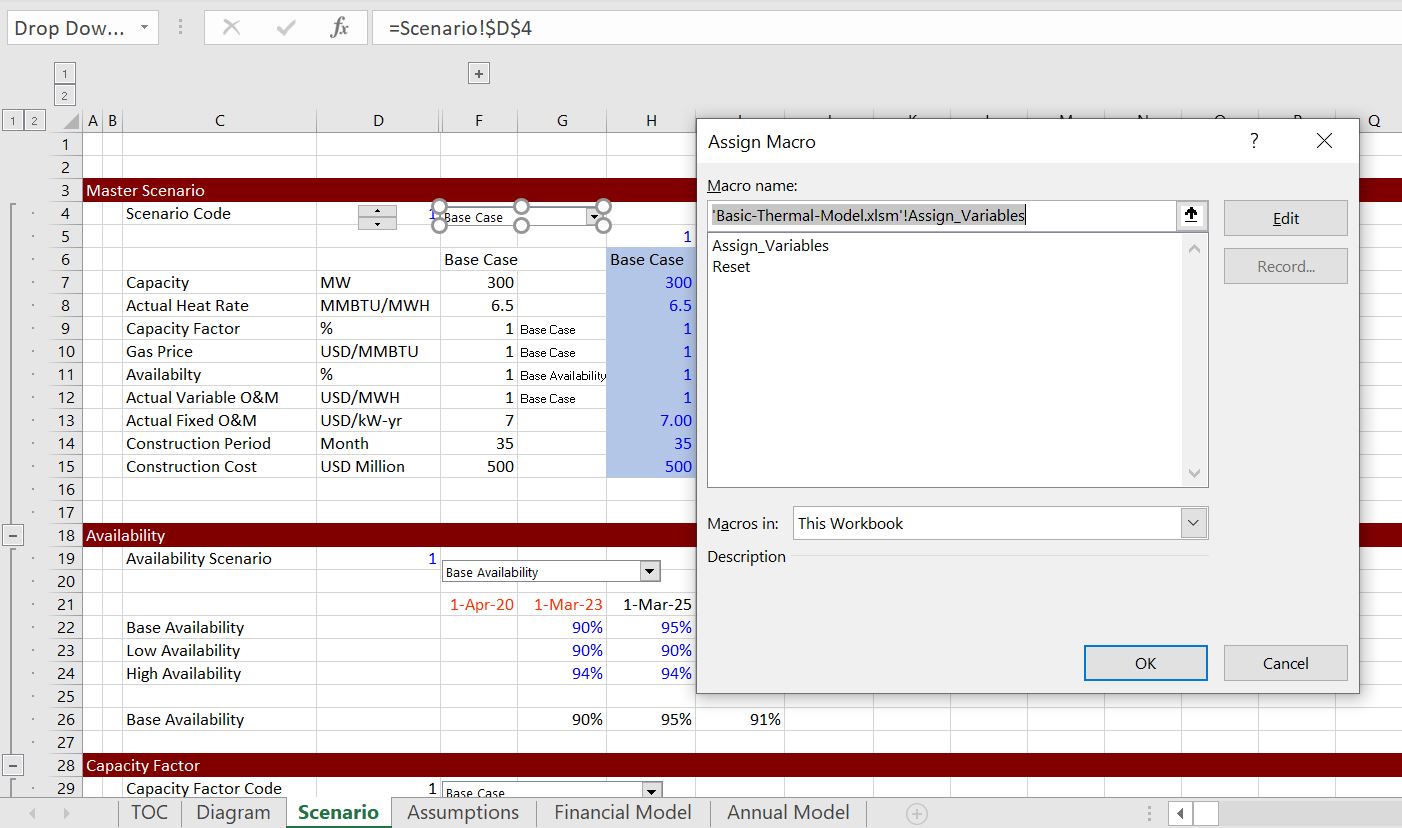
The screenshot below demonstrates how to attach a macro which copies the values in the INDEX/code number column to the applied column. You can just assign the macro to the drop down box that changes the scenario. The code for assigning variables is illustrated below. Note again that you can assign variables directly in the input sheet.
Putting Applied Variables Directly in the Input Page
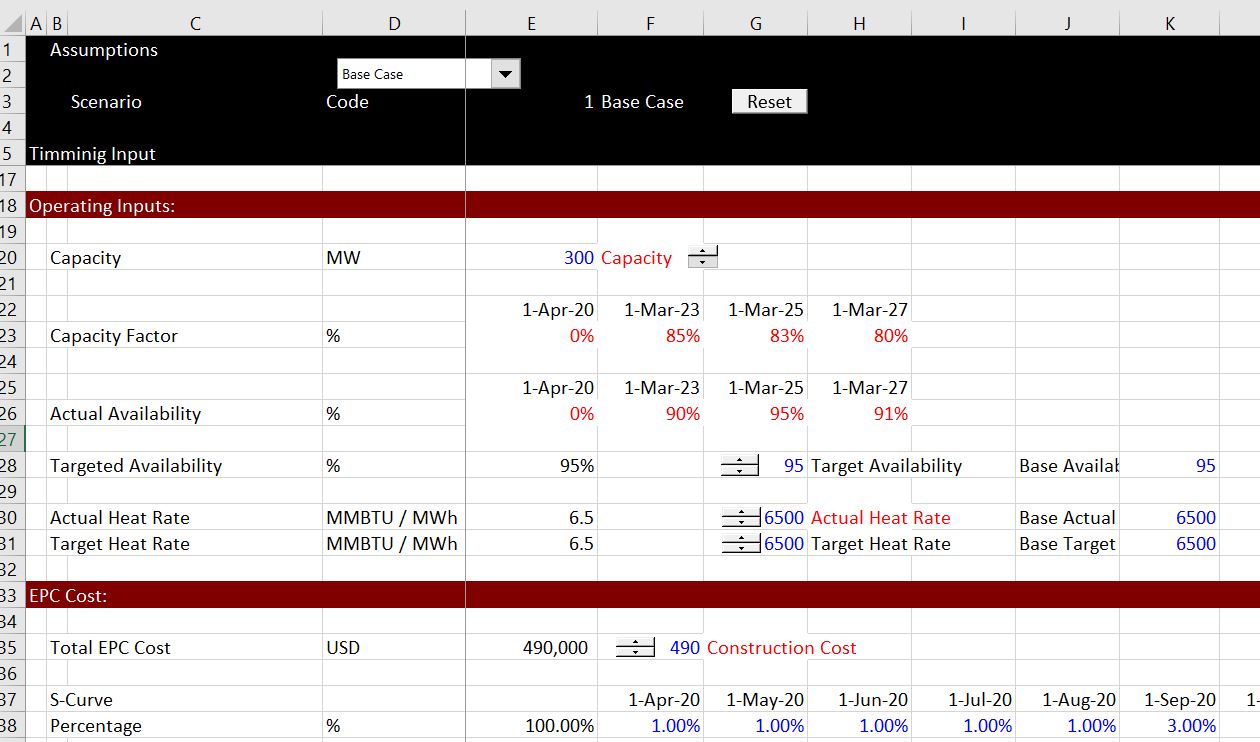
The screenshot below illustrates how to directly put the applied variables into the input sheet rather than in a column next to the INDEX/code number column in the scenario sheet. You may want to do this so that the input sheet does not have any links with equal signs. In the screenshot, the range name is placed next to the construction period.
VBA Code for Copying Variables from INDEX/Code Number Column to the Applied Column
The code below is for copying the variables from the INDEX/code number to the assigned variables. To write this code, you can use the F3 short-cut to paste all of the range names. Then copy the range names into your VBA code and you can very quickly make the equations.
Sub Assign_Variables()

Range("Actual_Heat_Rate") = Range("Actual_Heat_Rate_Scenario") * 1000
Range("Capacity") = Range("Capacity_Scenario")

Range("Actual_Fixed_O_M") = Range("Actual_Fixed_O_M_Scenario")
Range("Actual_Variable_O_M") = Range("Actual_Variable_O_M_Scenario")
Range("Availabilty") = Range("Availabilty__Scenario")

Range("Capacity_Factor") = Range("Capacity_Factor_Scenario")
Range("Capacity") = Range("Capacity_Scenario")
Range("Construction_Cost") = Range("Construction_Cost_Scenario")
Range("Construction_Period") = Range("Construction_Period_Scenario")
Range("Gas_Price") = Range("Gas_Price_Scenario")


End Sub
Video Describing the Process
The video below walks through how to create diagrams like the ones shown above with both spinner boxes and with scenarios.
[wonderplugin_video iframe=”https://www.youtube.com/watch?v=ZzxxTtuOCH4″ videowidth=600 videoheight=400 keepaspectratio=1 videocss=”position:relative;display:block;background-color:#000;overflow:hidden;max-width:100%;margin:0 auto;” playbutton=”https://edbodmer.com/wp-content/plugins/wonderplugin-video-embed/engine/playvideo-64-64-0.png”]
This is a video using the same method to create a tornado diagram
[wonderplugin_video iframe=”https://www.youtube.com/watch?v=rM0hpCRi9H8″ videowidth=600 videoheight=400 keepaspectratio=1 videocss=”position:relative;display:block;background-color:#000;overflow:hidden;max-width:100%;margin:0 auto;” playbutton=”https://edbodmer.com/wp-content/plugins/wonderplugin-video-embed/engine/playvideo-64-64-0.png”]
Case Study for JAE on Scenario Analysis
If you want to try this by yourself, I have created a case study for my friend Jae who asked me for some homework assignments. I have been feeling guilty about not completing these assignments and I have made one based on a wind model that includes the UDF. This exercise is included in the file attached to the button below. I have included a few variables for the scenario analysis but left you to fill in the rest including a diagram.
Excel File for Exercise in Creating Project Finance Structure with Sensivity and Scenario Analysis