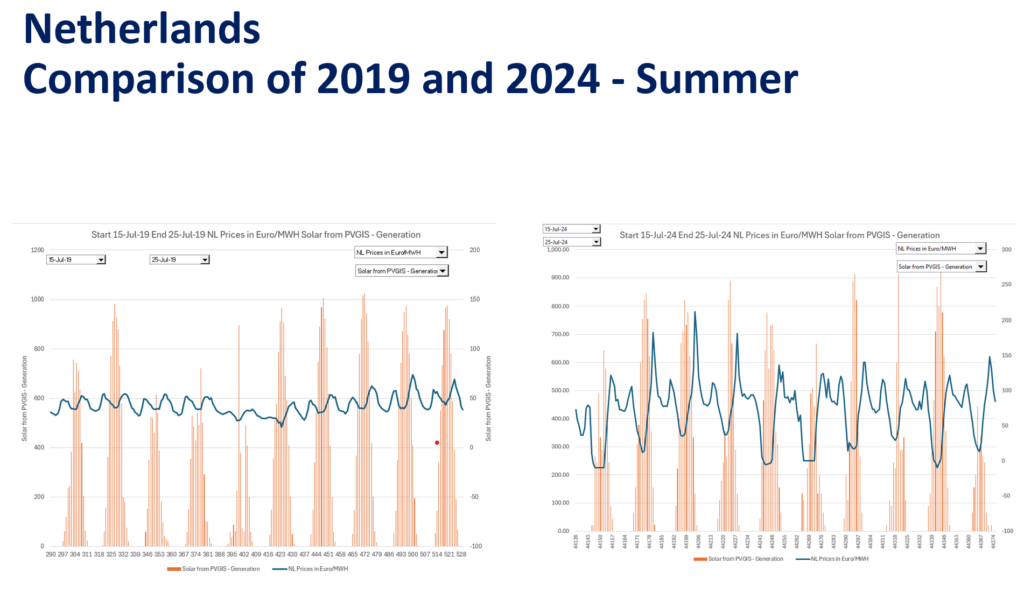
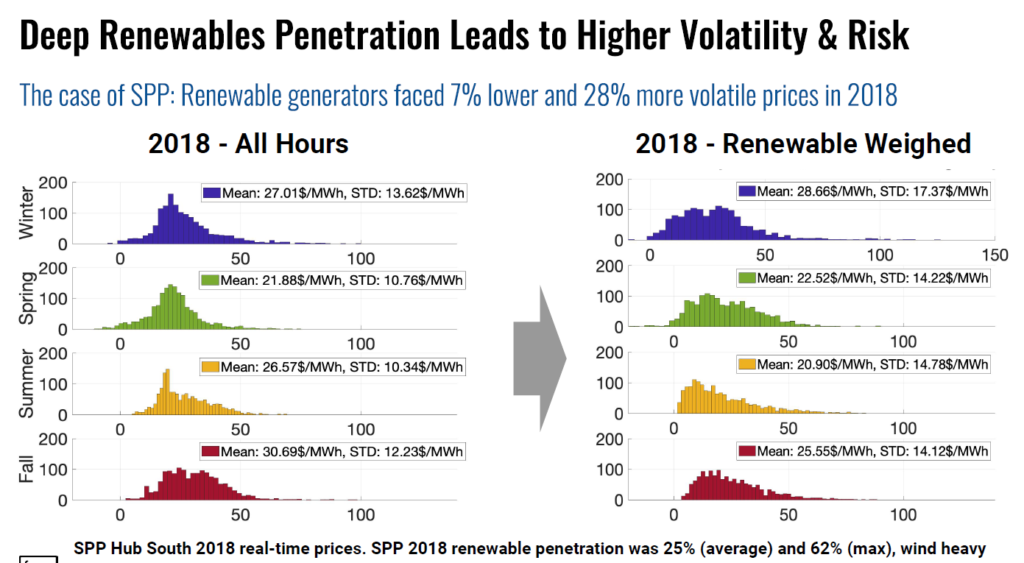
I used to think the NordPool website was good and it has turned into a horrible place to get merchant price data. Now you can go to the link https://ember-energy.org/data/european-wholesale-electricity-price-data/ and you do not need Nordpool that was destroyed by private equity. On this page I describe European prices and how to study prices in the presence of more and more renewable energy. I have completed a study of European prices and the value of storage using hourly price data along with natural gas prices and amounts of renewable energy. This demonstrates the dramatic increase in the value of storage and the increase in volatility of prices during short periods. The widgets below are attached power point slides that explain volatility and the value of storage as well as other principles of pricing. An example of illustrating changes in the volatility of prices is shown in one of the pages from the power point slides below.
.
.
.
.
.
.
Historic Market Prices
.
.
.
.
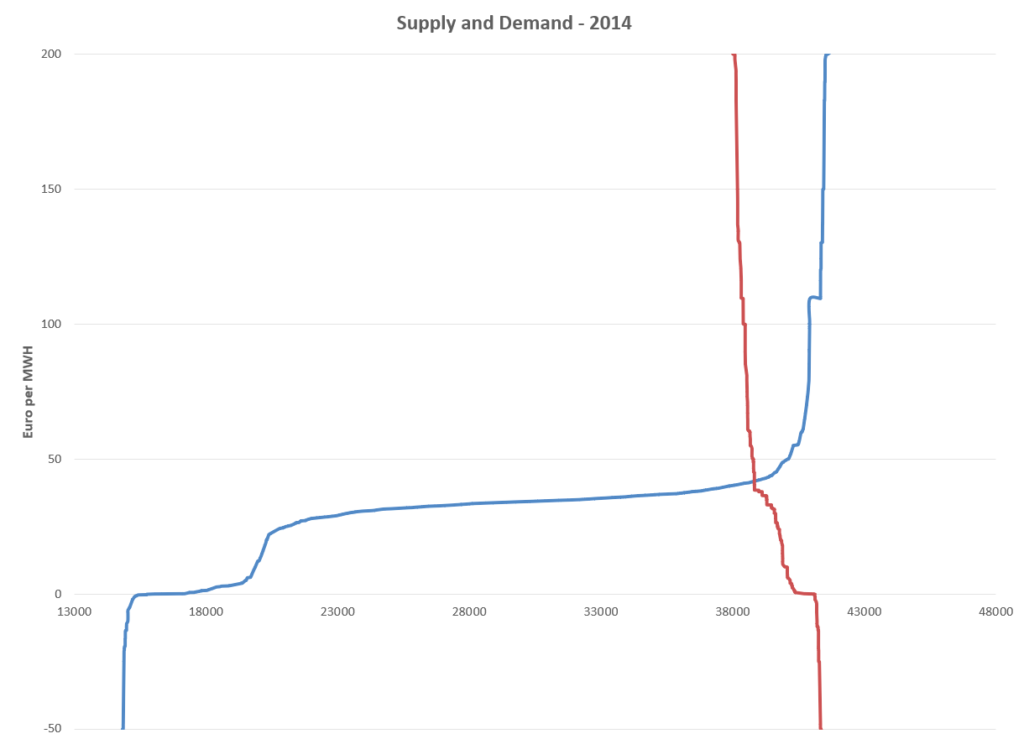
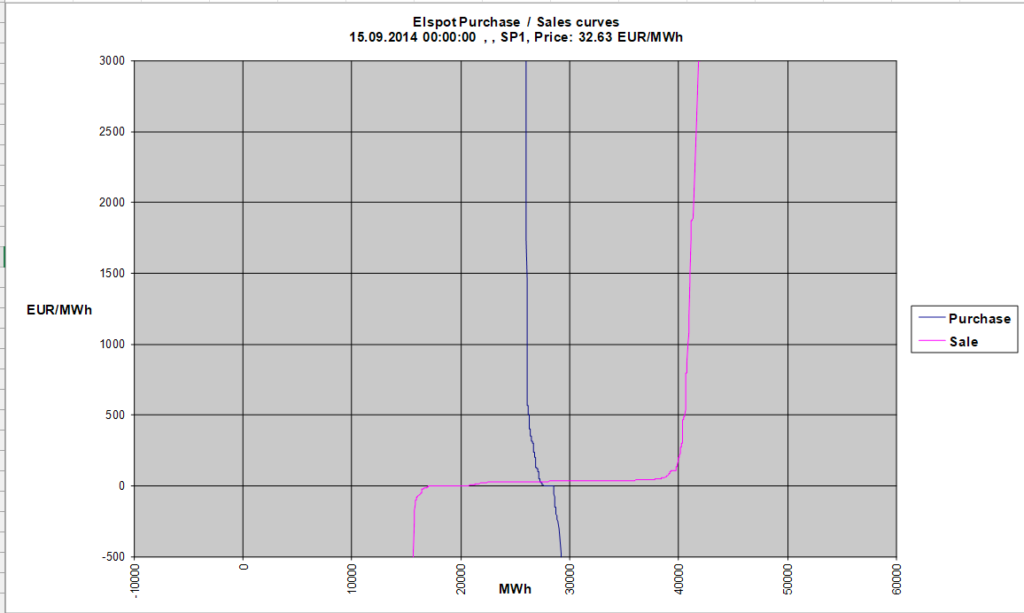
Supply and Demand and Merchant Price Theory
.

.
.
.
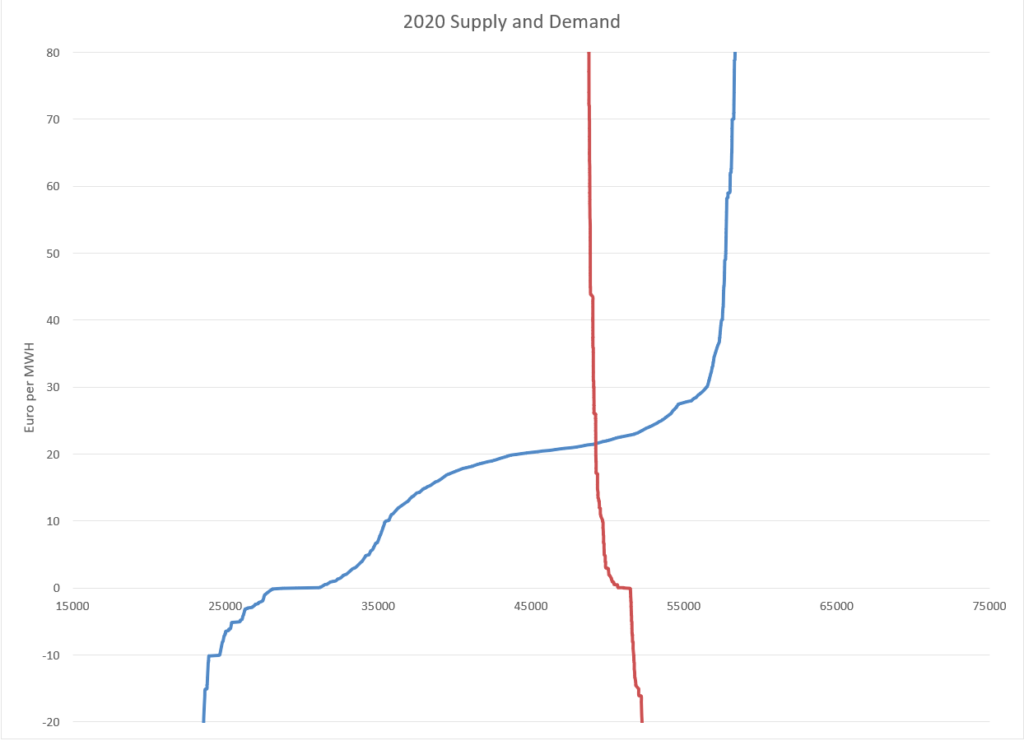
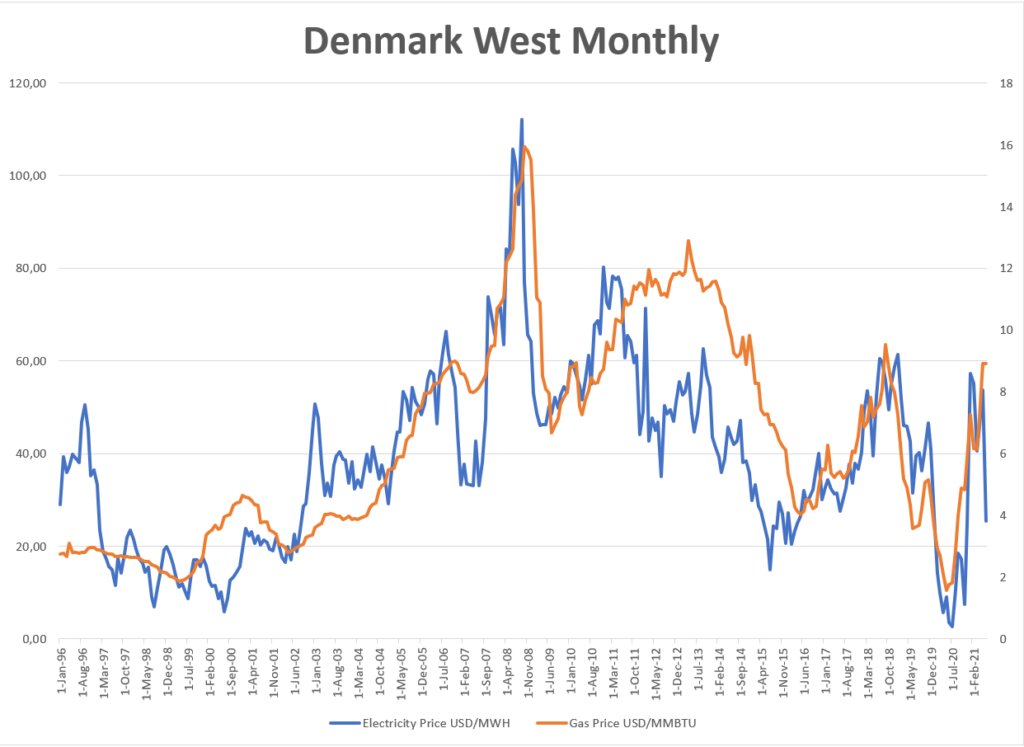
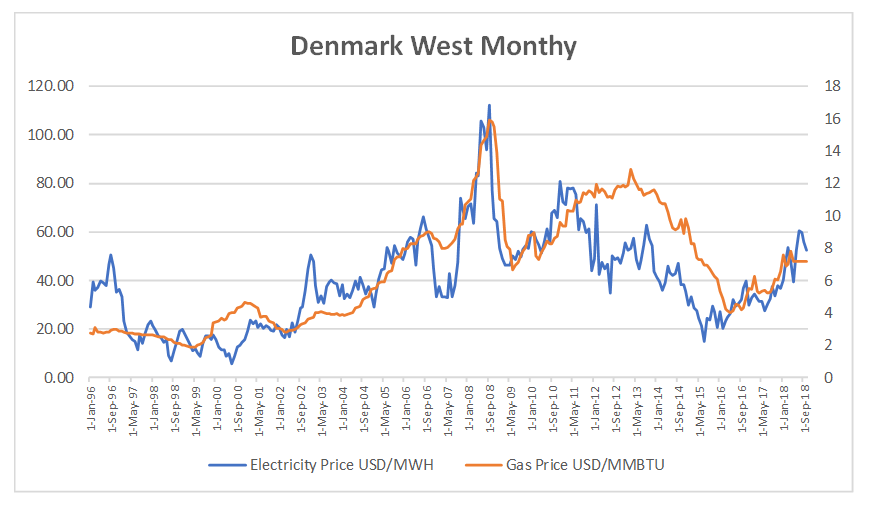
As with other markets, the NORDPOOL merchant electricity price data is translated into USD (from Euro). In addition, the European natural gas price is included in the database. To facilitate the translation, the file that I use to read in currencies is also presented. The type of analysis you can derive from this database is illustrated in a few graphs below. One thing to note how prices dropped dramatically in 2020. You may think that this is related to renewable energy and a whole bunch of wind power. But when you graph the natural gas price together with the electricity prices, you can see that the decline in gas prices is more explained by the decline in natural gas prices.
.
.
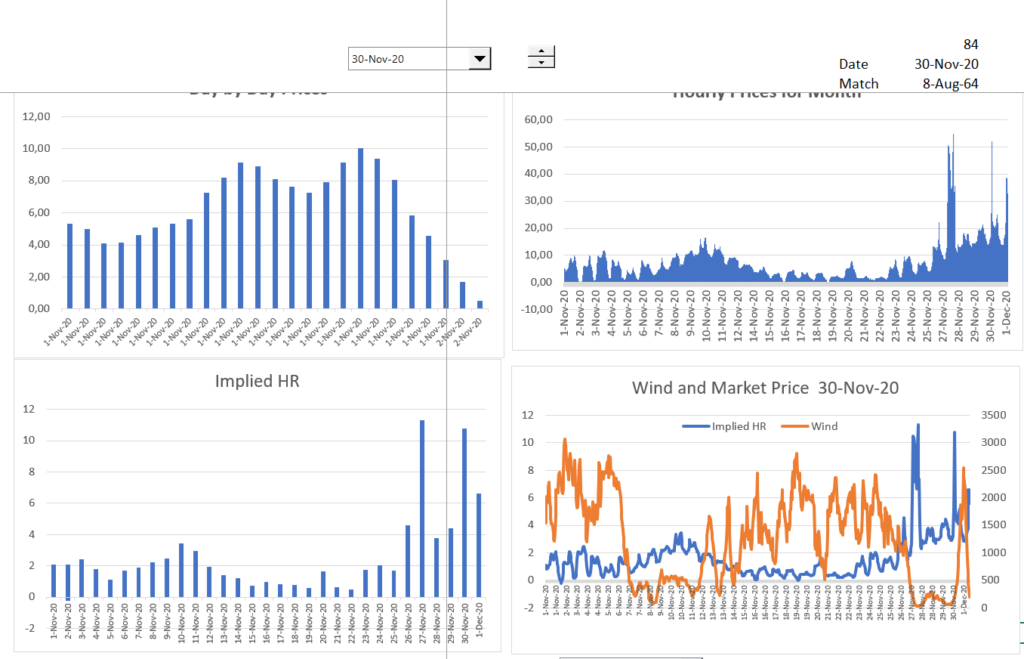
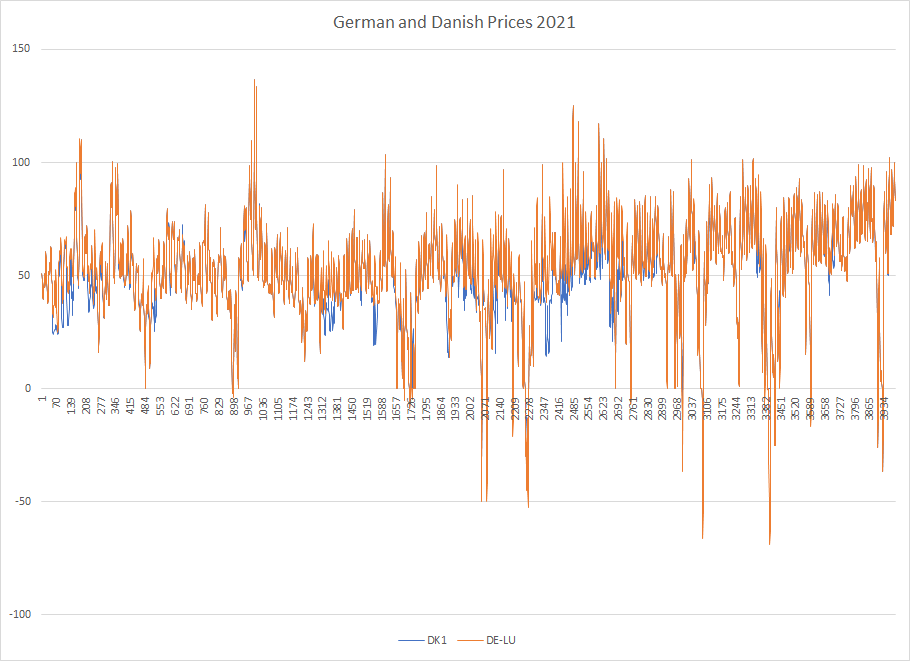
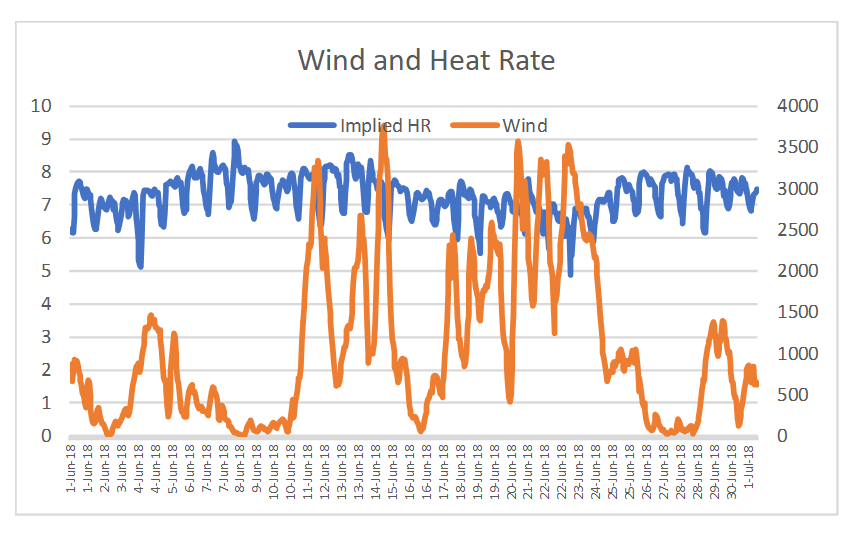
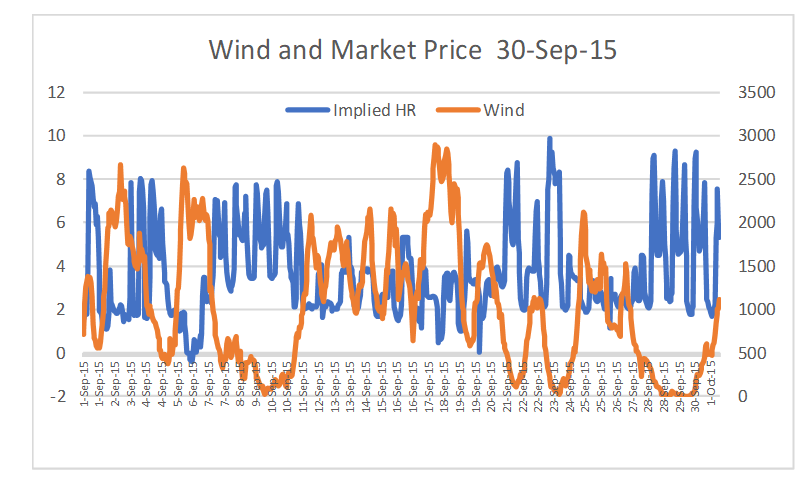
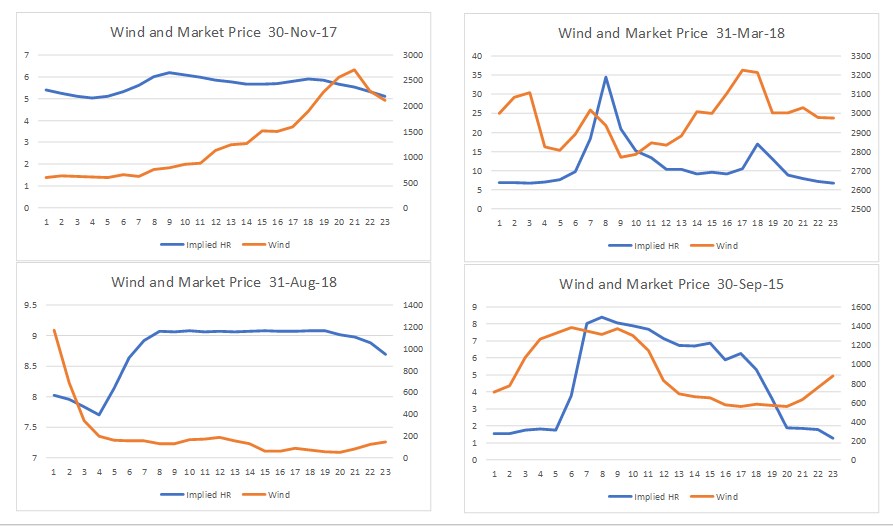
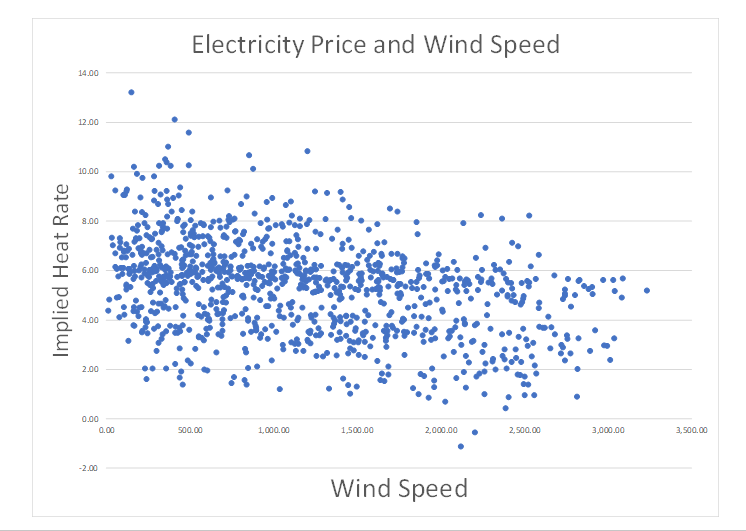
The second graph shows the relationship between short-term prices and wind generation. The relationship can be evaluated more by evaluating hour-by hour data than by accumulating the data over a month. The bottom right hand graph illustrates the inverse relationship between the prices an the amount of wind in a fairly dramatic manner. You can open the data base and mess around with the data and look for different relationships. I think this case of Denmark is particularly instructive because of the large amount of wind power in Denmark. I hope this extremely short introduction motivates you to want to update the database and work with the data.
.
How to Update the NORDPOOL Merchant Price Electricity Price Database by Yourself
.
As with other merchant price data, I have tried to make it the updating process automatic the way you can download data from FRED or the way you can download stock prices, but this may a stupid objective. In developing a database of merchant prices, I think the aim is to make an hour by hour file that is flat. This means that prices of electric power in different currencies as well as natural gas prices and coal prices are in a single column with multiple rows. After you get this, you can use all kinds of LOOKUP’s, AVERAGEIF’s, MATCH’s and INDEX’s to put together different kinds of analysis. For me, when I update the files and maybe for you, I begin by describing how to update (and create) this big flat file which is a page in all of the merchant plant databases. As with many things in life, you can try different things in different files on a kind of random basis and then find something that is really effective. A few of these things are to created a column with the year so you can navigate with the CNTL up and CNTL down. Also using ALT, E,I S with 8760 or 8784 to count the hours in a year is very helpful. Finally, using date counters when you add 1/24 instead of 1 to count by hour is very helpful.
So, here is the step by step process for updating the UK price data. As with other databases it is helpful to use the following data format for the hours and the days. I use this so that I am not confused by U.S. date formats. Press CNTL, 3 to get the format etc.
d-mmm-yy h:mm
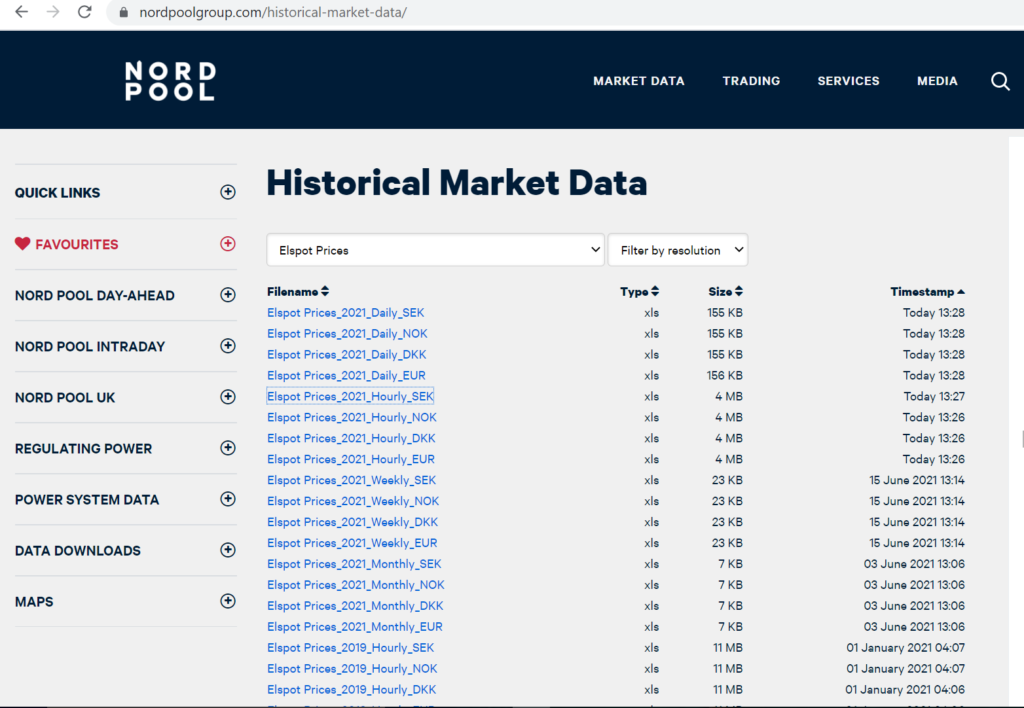
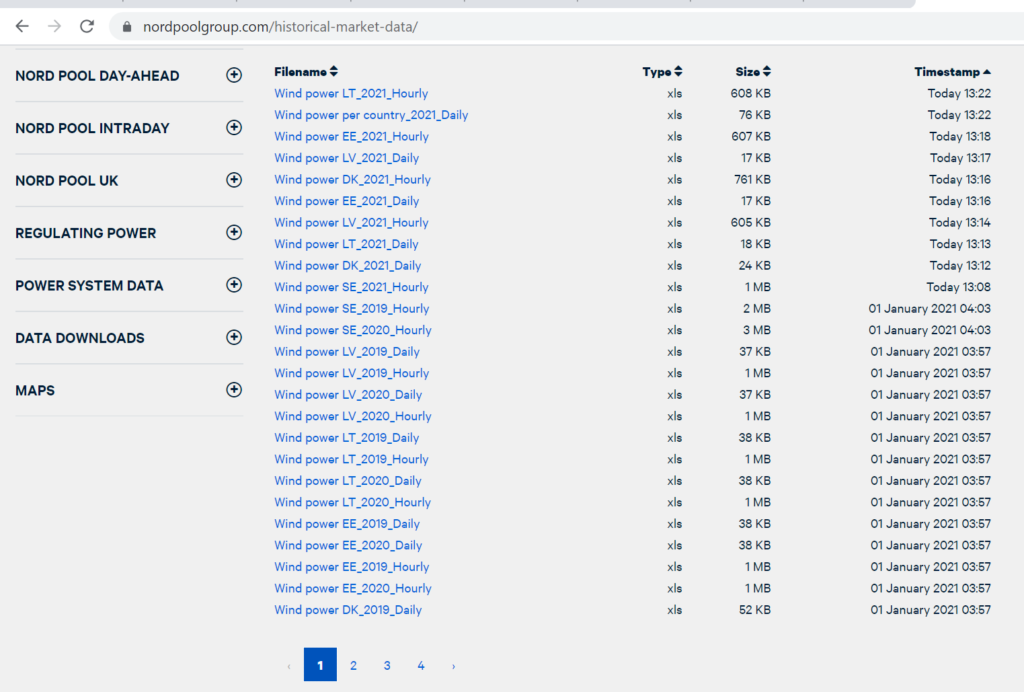
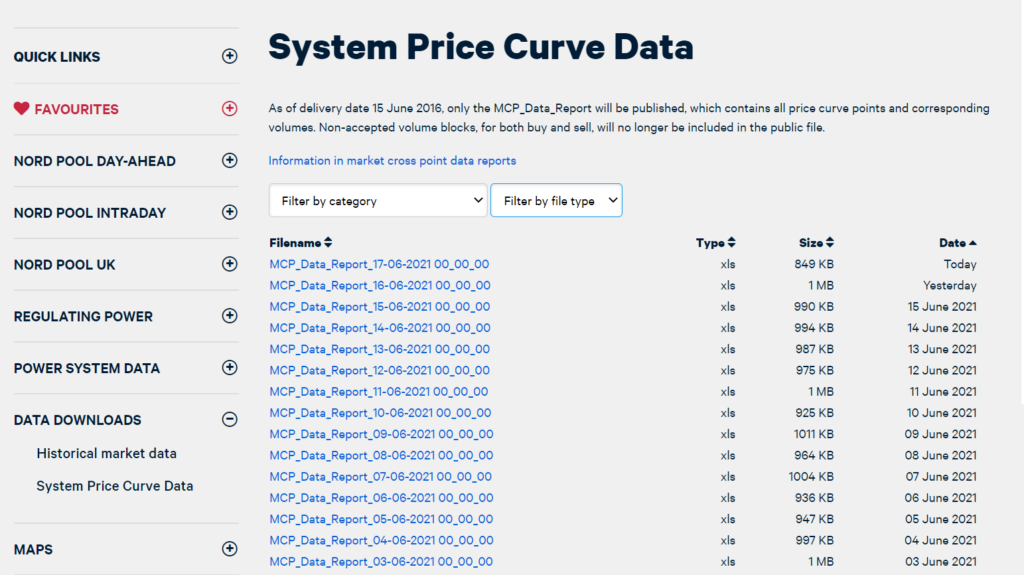
n general, the data can be easily updated in an automated manner because of files on the Nordpool website that can be read into a workbook using the WORKBOOKS.OPEN statement in simple macro. But the website is updated sometimes and the URL’s change. So, rather than just pressing a button, I try to explain what is going on with the macro when you press the button. For the rest of this section I am trying to explain how you can update the database by yourself. I really hope that you can update the database in a few minutes with the instructions below. First, you can navigate to the market data from the home page which is illustrated below.
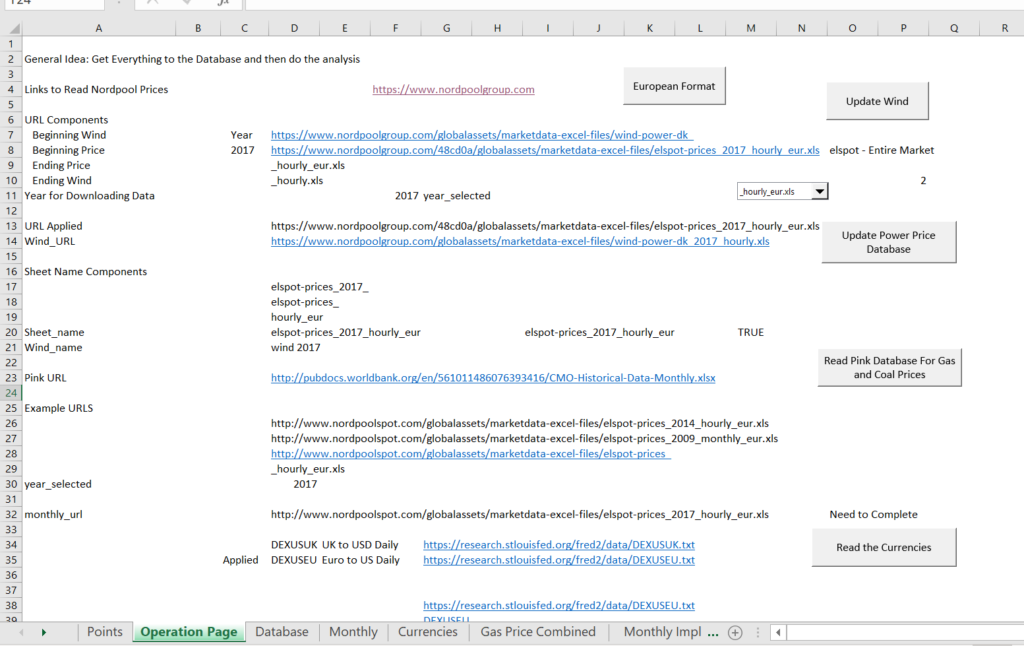
The screenshot below shows the operation page of the database. There are a few macros that you can press and hopefully do not have to make too many manual adjustments. The buttons have macros that read prices from the website; read wind volumes from the website; read exchange rates and read natural gas prices. When you read in the hourly data, you can put the hourly data together with data that was collected for earlier periods.
.
When in the website, go to market data.
Using the macro shown below, you can get data for Germany and France since 2020. But unfortunately you cannot get this data for earlier periods.
When updating the file and collecting new data, you will probably need to collect URL’s using the F3 function key as illustrated in the screenshot below. In the example below, I collect data from Germany — the DE-LU code.
To get this page I need to google it — I am bad at finding the page on the website — .
.
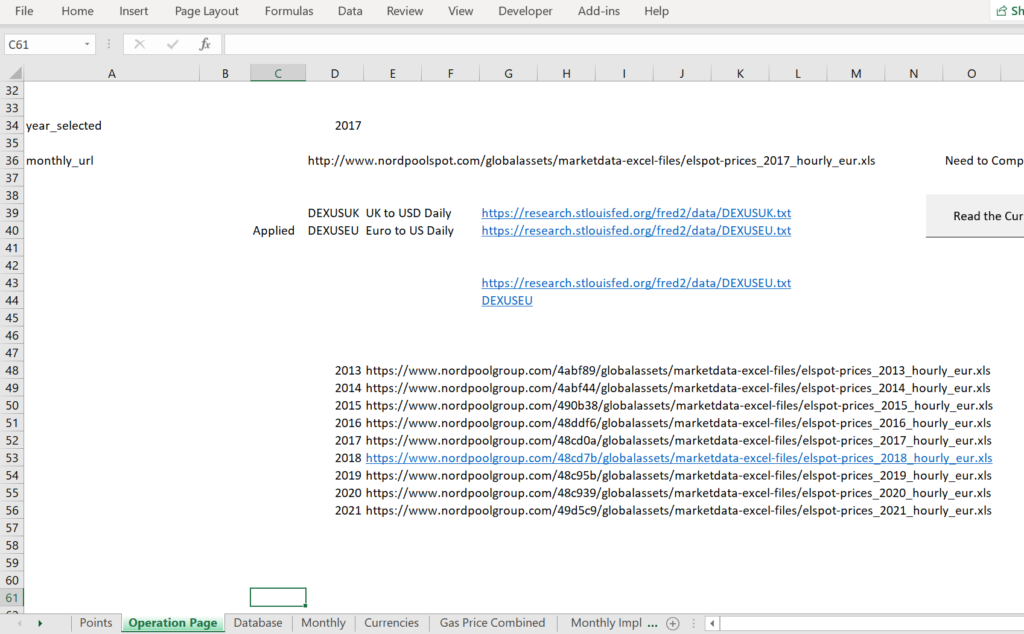
Once you press the F3 key to collect the URL, put it in the operation page of the database as illustrated below. You may have to adjust the INDEX function when you read in different years.
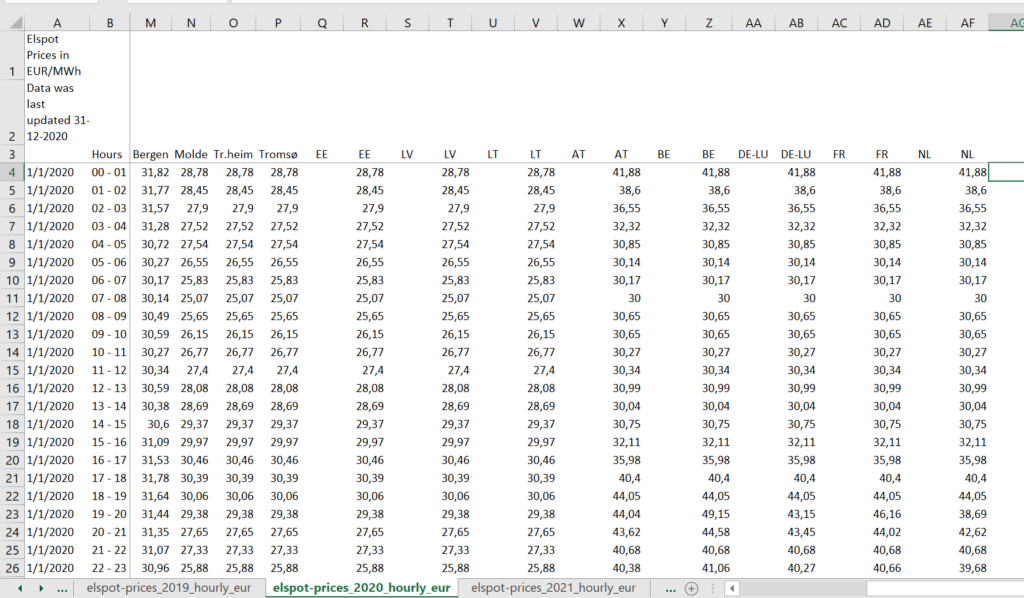
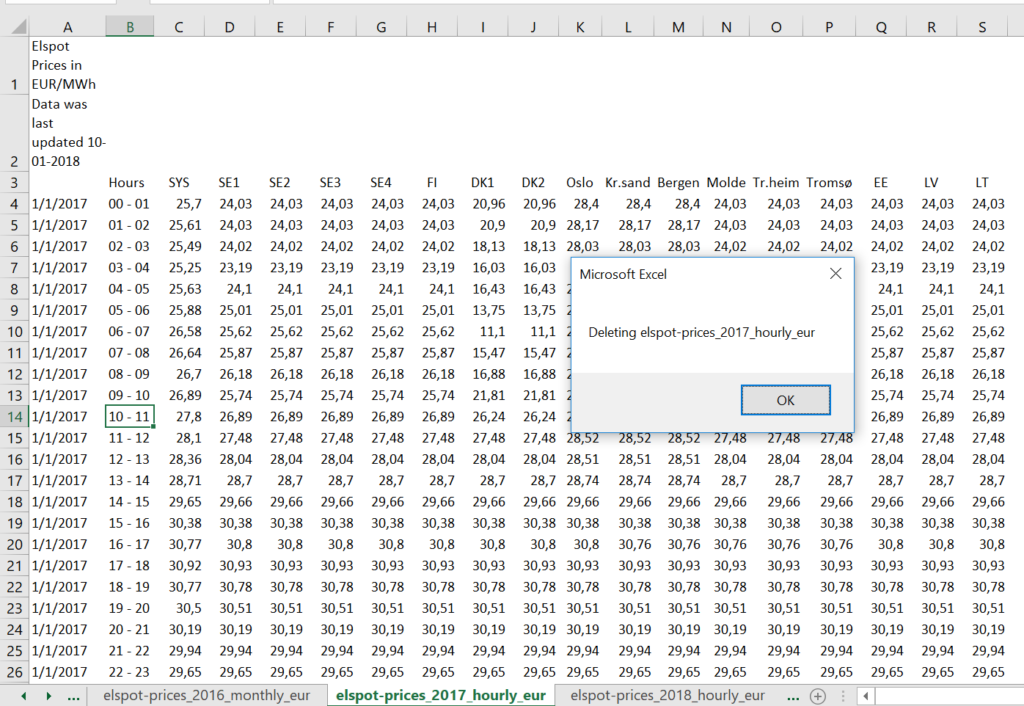
After yo press the button to read the hourly prices, you will be prompted for the years you want to read. Do not worry about the historic years because they are already in the database. The macro puts the new data into a sheet like the one shown below.
To read the wind data by region, you may have to do some more work. Each region has a different wind series and if you want to get different regions you will have to go to the website and collect the URL’s as illustrated in the screenshot below. After you collect the URL’s the INDEX function is used to collect the hourly data and put the wind data into separate sheets.
When you run the macro, you can over-write historic data for years that are not complete. In this case, the prior sheet is deleted and a new sheet is made. The macro shows that you are going to delete the file. The screenshot also shows how the hourly data is collected. After the hourly data is collected, it is converted to a single column time series using the indirect function.
You may have to update the URL for the monthly data using the world bank data. To do this, go to the world bank website on commodity prices using the link:
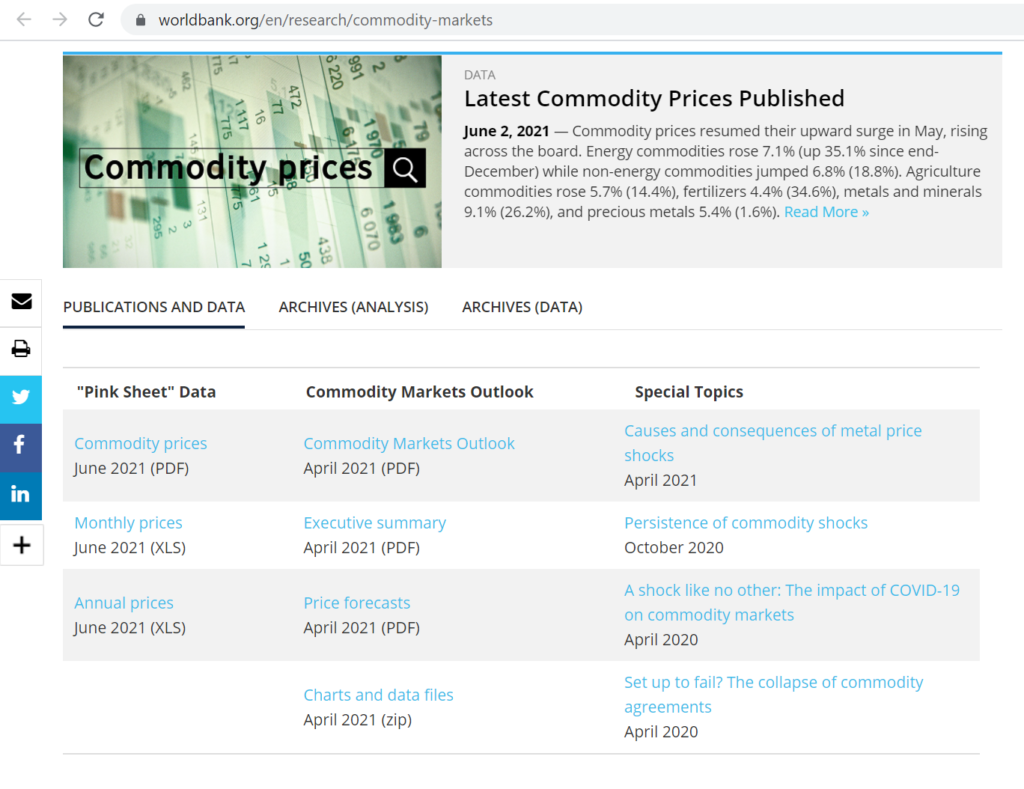
Then, right click on the monthly prices download illustrated above and copy the URL to the spreadsheet in the workbook. This link is in the sheet named “download data.” The URL should be placed in Cell D6.
The link that was relevant for 2021 prices is the link below. It is very possible that this link will change and you will have to update the file to read the natural gas prices.
Working with the Database
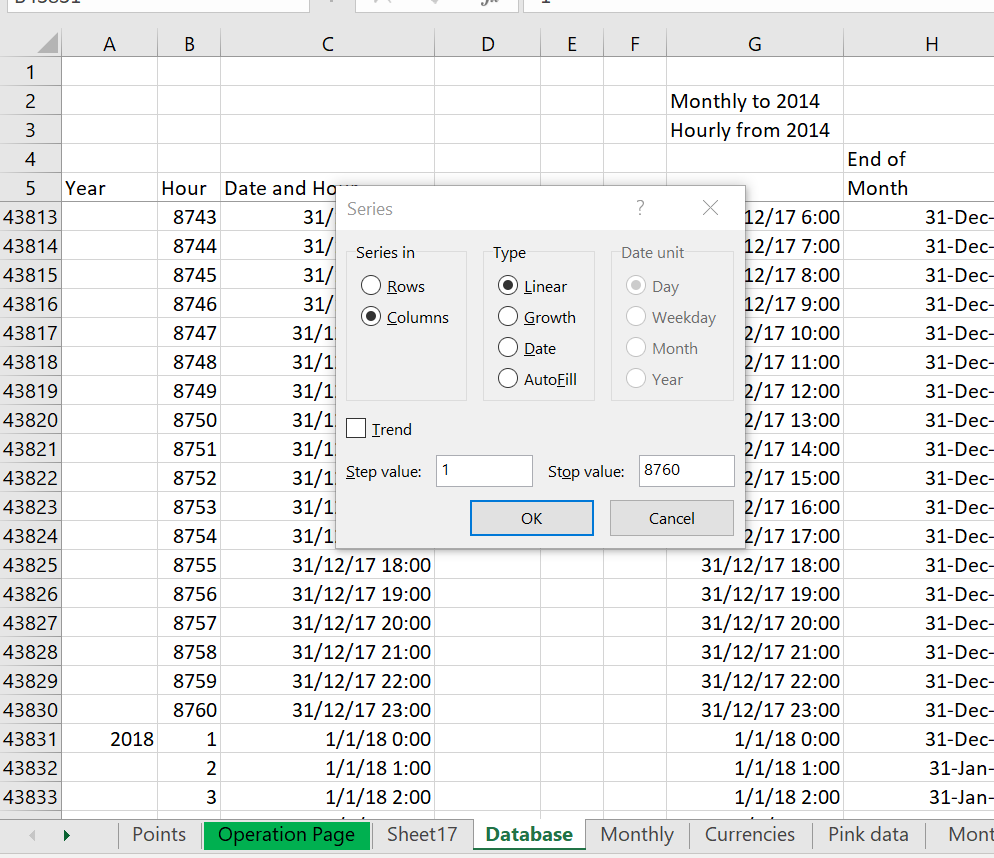
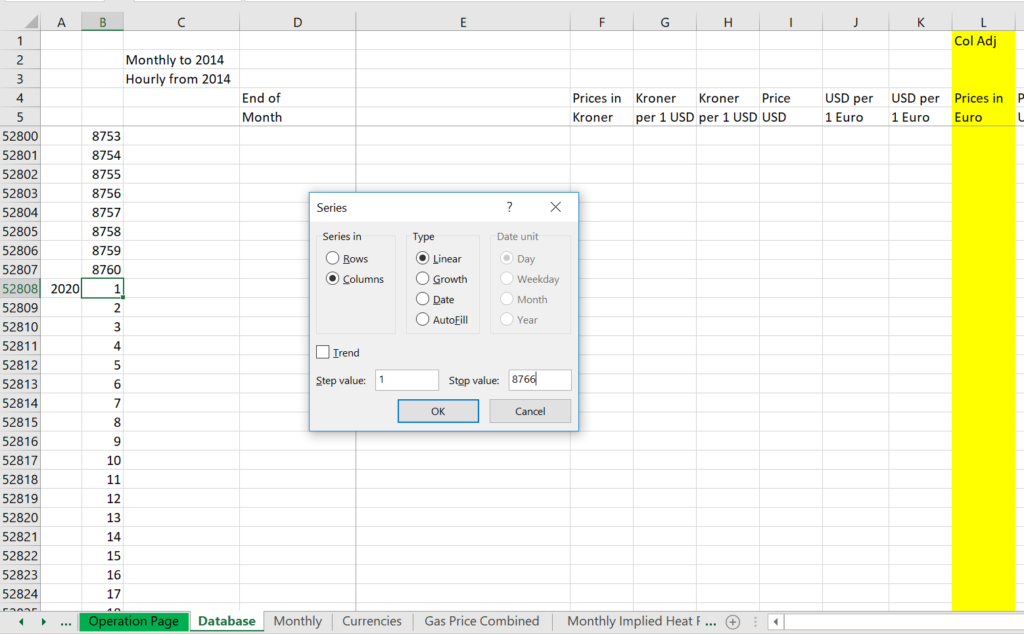
The idea behind all of the databases for merchant prices is to get the prices arranged in a single column with hundreds or thousands of rows. In addition, the gas prices and the exchange rates can be put in the master database. It can be a pain to work with really big databases that have 8760 or 8784 observations for a year and where you have to worry about standard daylight savings time. I suggest a couple of things and I have tried to put some of these ideas in the database. First, in column A (or Column B) if you want to make A an elevator column, put in the year and then leave the rest blank. This is like a column header in a financial model. Then, if you are adding a year, use the ALT, EIS short-cut to get a series of 8760 or 8784 rows. This is illustrated in the screenshot below.
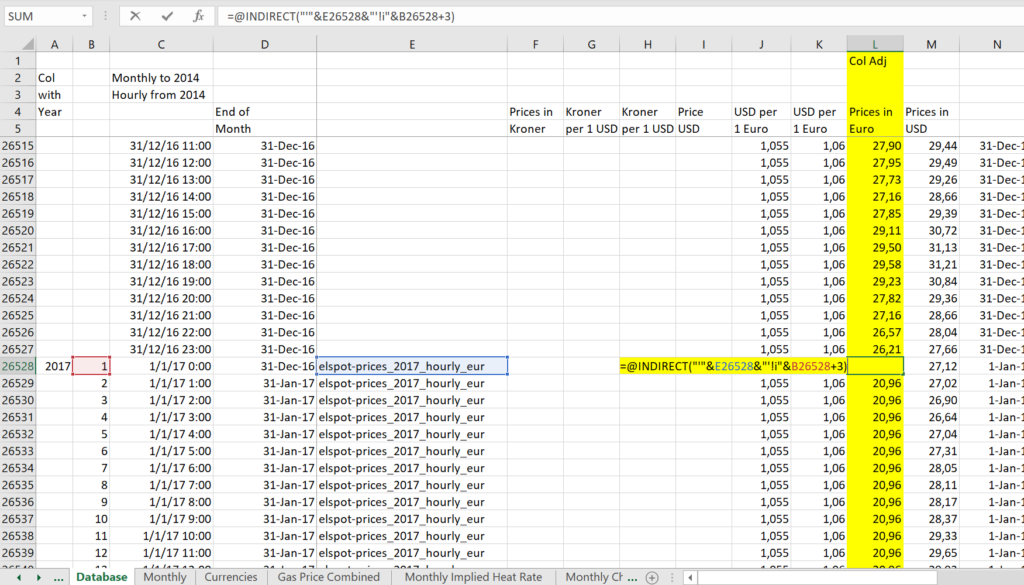
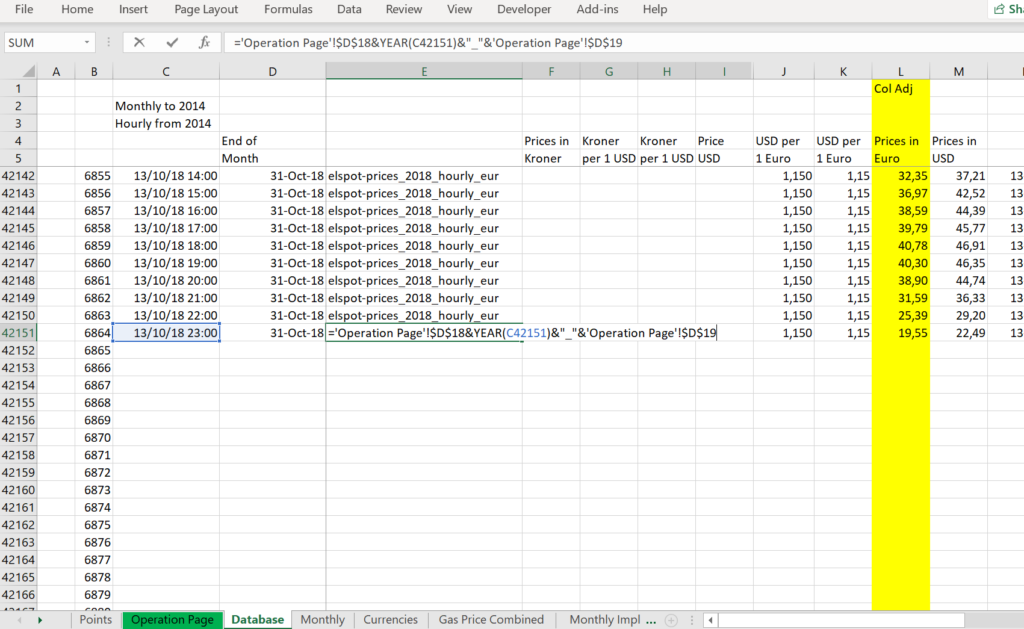
Once you do this, you can put in the dates using the idea that in excel, when you add 1/24 to a date you get the next hour. Then you can format the date with the hour and you are about ready to go. You can use the hourly counter and the name of the sheet that is read in to create a string that can be used with the indirect function. Then the prices should be read right in. The process for creating a string for the use with the INDIRECT function is illustrated below.
Extending Data after Downloading the Data
Price data with years
A lot of the data extraction works with the INDIRECT function. One important part of the analysis is the extraction of the relevant price data for the various regions. In the example of the screenshot below, the column is “I”. This implies that the price is for DKK 1 or Denmark West. You can see this by looking at the hourly data in the screenshot above. If you want to change the prices to Germany, you could do this for the years 2020 and 2021. The column for Germany is
Monthly Data
Wind Data
First, note that you must change your excel to the European format (with commas and points). You can do this by pressing the macro on the first page. When you are finished updating, you can press the re-set macro.
Step 1: When updating the data, go to the operation page of the NORDPOOL database. You should get the hourly data and not monthly data because the hourly data can give you more interesting analysis. Make sure the drop-down box is set to hourly. To do this press the update button. Existing hourly sheets will be deleted.
Step 2: Copy and paste data from the main currency workbook and from the commodity price workbook after you have updated the links (note you have to be careful about the decimal problem). The monthly commodity prices are copied to the pink data sheet and the Euro Exchange rate is copied from the daily currency database to the sheet named currencies.
That’s basically it.
Creating a Bid Curve from the Data
The hourly price starts in 2014. Before that the file includes monthly data.
When adding a year, you may have to add another year to the database. Then, you can copy the new data from the prior rows with values.
Lessons from Studying the NORDPOOL Merchant Electricity Price Market
The system price at in the Nord pool market can give insights into European markets and it demonstrates how a lot of hydro capacity can affect prices. Nordpool is a transparent website in which you can easily download hourly historic data.
Nordpool has correlation with natural gas prices but somewhat less than other markets because of the large amount of hydro power. The Nordpool market also has similar general trends as the German market discussed above.
Technical Discussion
For updating, the macro has an error test as follows:
Range("sheet_name").Calculate

error_code = 0
On Error GoTo finish_delete: ' Not found so don't have to delete

Sheets(sheet_name).Select ' if sheet is not there, this is an error

delete_sheet:
error_code = 1
MsgBox " Deleting " & sheet_name

Sheets(sheet_name).Delete
Sheets(base_sheet).Select
On Error GoTo 0
finish_delete: