This page demonstrates fundamental ideas about creating a scenario analysis with a combination of the INDEX function and the Data Table tool. To explain the scenario analysis I use my favourite model — the banker’s life model that shows marriage, relationship and affair scenarios. The fundamental notion of creating scenario analysis with the INDEX is that you should set up a scenario code number. Once you have a scenario code number you can use the INDEX function (or the CHOOSE function) to pick a scenario. After you understand how to pick a scenario, you can create a scenario page that has the results of the analysis in terms of things like the IRR, ROIC, EPS per period and other factors. You can then also add a dropdown box (named by excel a combo box) to implement your scenario in different pages. Other more advanced issues including building tornado diagrams, waterfall charts and using flexible spinner boxes are discussed in subsequent pages.
Starting Point: Code Number – Example with Banker’s Life Valuation
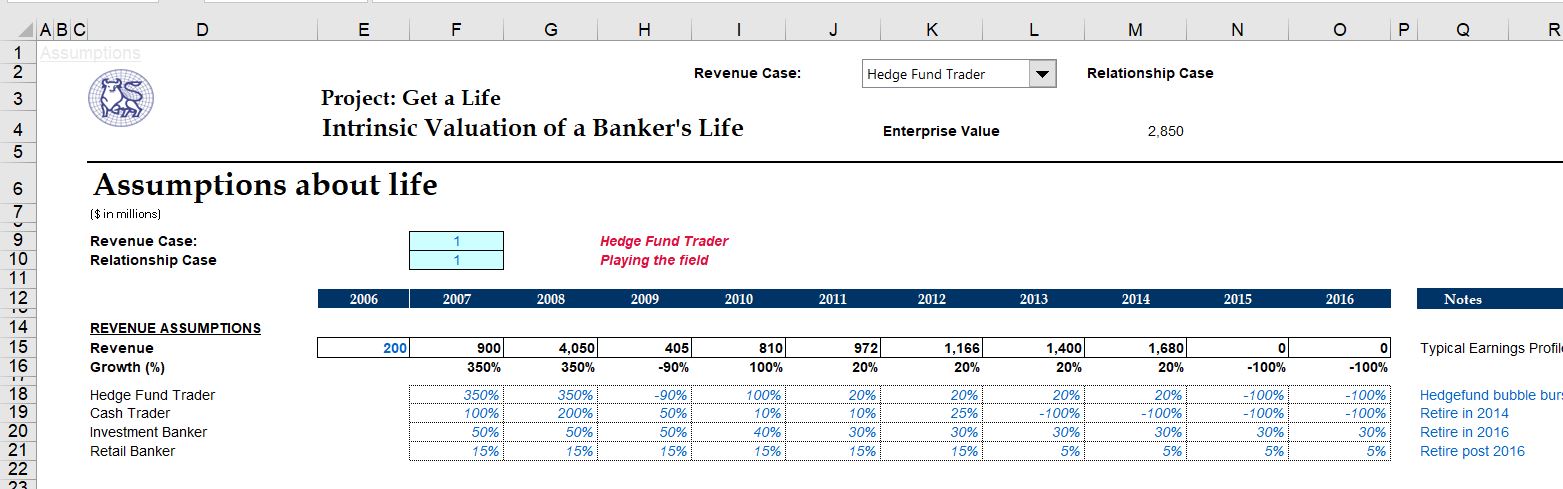
Somebody gave me the file below before the financial crisis. It was made by Merrill Lynch, the company that was about to fall after Lehman but was rescued by Bank of America. The file contains different career scenarios for bankers and computes their enterprise value. Each career scenario is given a code number. In addition there are scenarios associated with the relationship case (note that “playing the field” means you have no commitment whatsoever). (I do not necessarily agree with result that having an affair increases value relative to a successful marriage.)
The screenshot below demonstrates how the code numbers drive the selection of scenarios. In this case you can try to change the code number for the relationship case and see what happens to the enterprise value of the banker. You can also change the revenue case which is the career option. In this screenshot, the banker is a hedge fund trader which is associated with code number 1 and he or she is unattached completely meaning the relationship case is playing the field. Then you can try different code numbers for both the revenue case and the relationship case to get different valuations.
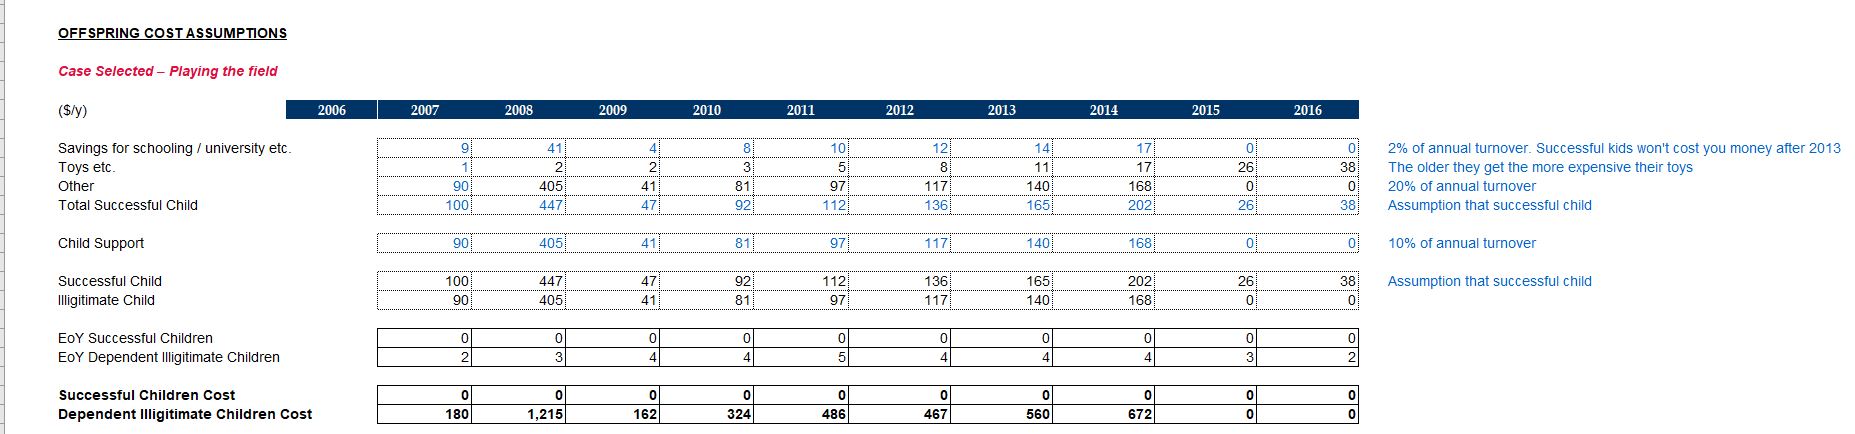
The second screenshot illustrates how the scenario cases themselves are set-up. This is not a really good example because the scenario is not clear. But the notes after each assumption are pretty good — like the cost of your illigitimate child.
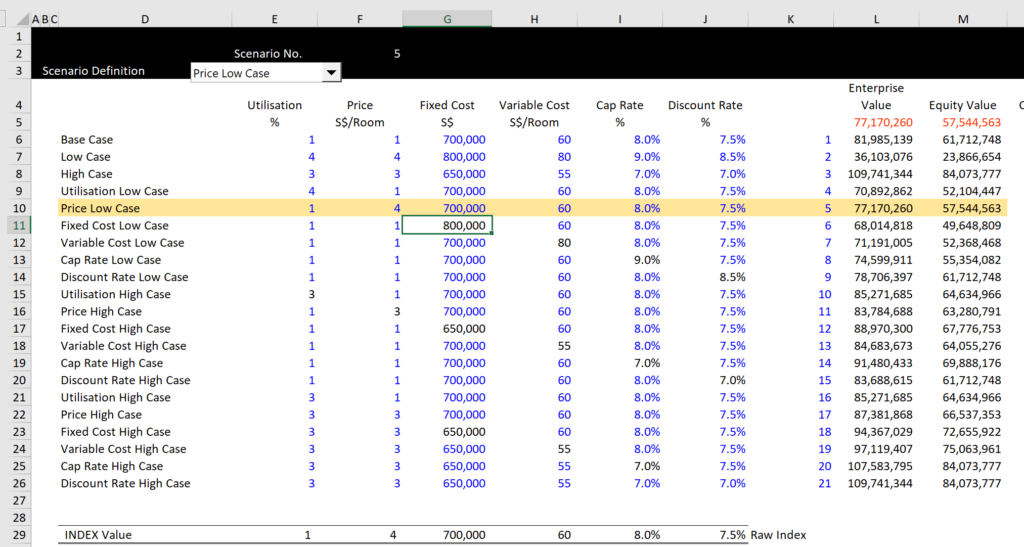
To make a master scenario page that has a base case, upside case and downside case, you can use the INDEX function combined with the DATA TABLE tool of excel. To do this, you should understand how a data table works and how the INDEX function can be used with a code number. The steps in this process include:
Set-up of a Separate Master Scenario page in Basic Model
Objective of Scenario Page
Understanding Data Tables for Scenario Analysis
Use of Code Number and INDEX or CHOOSE Functions
Presentation of Cash Flow Data with SUMIF
Putting together Scenario Analysis
Fundamentals of Creating a Tornado Diagram from a Scenario Analysis using a One-Way Data Table
Video and the file below demonstrate how to create a tornado diagram in just about any file. You need to set up a scenario analysis with a a base case, low case and high case. When you do this, the key is to use the INDEX function and put a code number for the scenario that is operating. Then you attach the inputs from your file to the INDEX function results in the scenario diagram. After making this basic scenario diagram, you should make your scenario analysis into a sensitivity analysis. To do this, use the TRANSPOSE function with the titles for all of the items in the scenario analysis. This is just like creating a whole bunch of new scenarios.Shortcode
Exercise Files for Construction of Basic Scenario Analysis
Files that you can find on the resource library that go through this stuff are listed below.
- Exercise 7 – Data Tables and Auto_Open.xlsm
- Exercise 1 – Data Tables without Macros.xlsm
- Exercise 9 – Basic Scenario Analysis.xlsm
- Exercise 8 – Data Tables and Save.xlsm
- Exercise 8 – Data Tables and Save.xlsm
- Exercise 9 – Basic Scenario Analysis.xlsm
- Exercise 10 – Basic Sensitivity Analysis.xlsm
- Exercise 11 – Basic Custom Scenario.xlsm