This page demonstrates how to construct a corporate financial model that is not a typical model that begins with detailed revenue and expense assumptions. Instead the model begins with assumptions about ROIC and growth rather than the typical top-down approach of using a whole lot of inputs and deriving cash flows ROIC outputs and valuation statistics. I have used the case of Amazon to demonstrate this alternative corporate modelling approach. I have used Amazon as an example because of the dramatic rise in Amazon’s stock price along with its history of earning moderate returns. This stock price increase raises the question (at least in my my mind) as to what kind of growth, return and cost of capital are required to justify the stock price. Working backwards from ROIC, growth and cost of capital with this analysis forces you to evaluate a lot of fundamental valuation concepts. As growth rates and returns change, the model cannot apply the simplistic McKinsey formula: Value = Earnings x (1-g/Return)/(Cost of Capital – growth).
The Amazon model that begins with the historic balance sheet and assumptions for ROIC, growth and cost of capital is available to download by clicking on the button below. This file can easily be used for other companies as it uses the financial database as a foundation.
Amazon Value Review and Stock Price
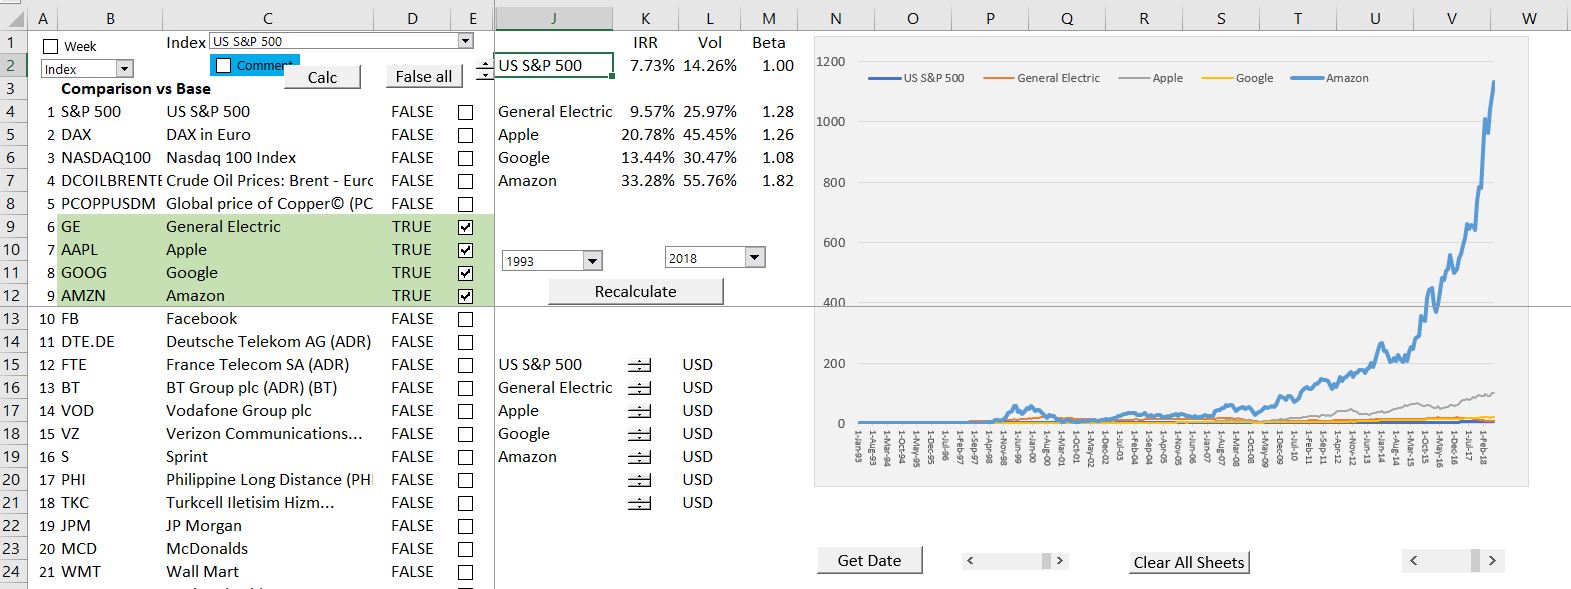
Before discussing the details of the model it is useful review the mystery of Amazon. Amazon’s stock price has risen in an crazy manner. One thing is sure. Nobody really knows what the value is. Nobody knows just how much Amazon Prime is worth or how much the Amazon Cloud is worth. Nobody knows how much Amazon can grow. Nobody knows what Amazon’s margin and R&D expenditures and capital expenditures will be. So making a model like was done on the prior page discussing general corporate models. We do know Amazon fundamentally has higher costs than other retail outlets because it must deliver goods rather than us going out to buy the stuff. The stock price of Amazon compared to Apple and the overall market is shown below. You can find this at http://edbodmer.com/comprehensive-stock-price-analysis/. The question is whether the stock price rise is like the Tulip bubble, the Saudi Stock price bubble, the 2000 Telecom bubble or whether the value is really there.
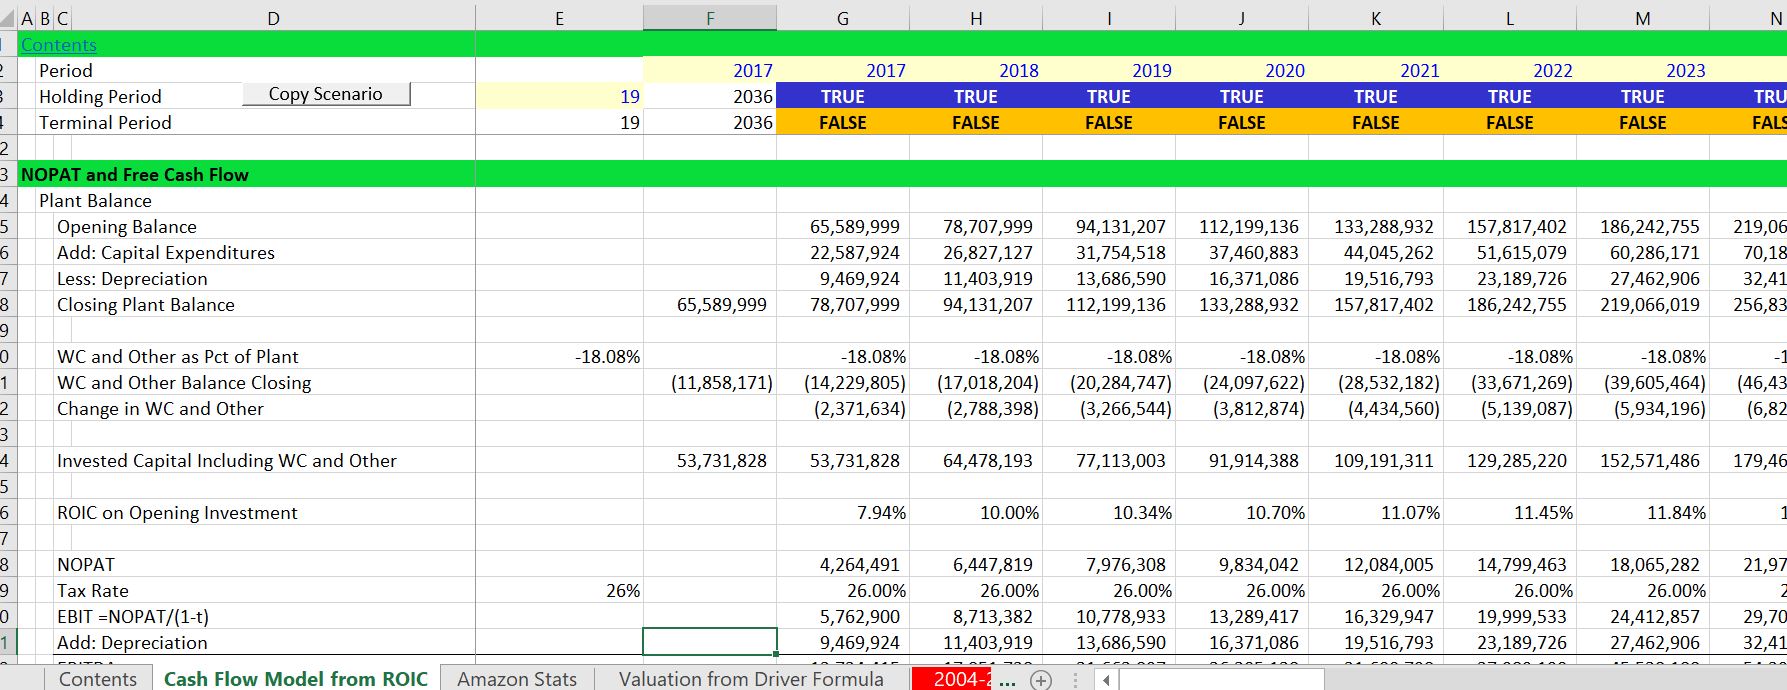
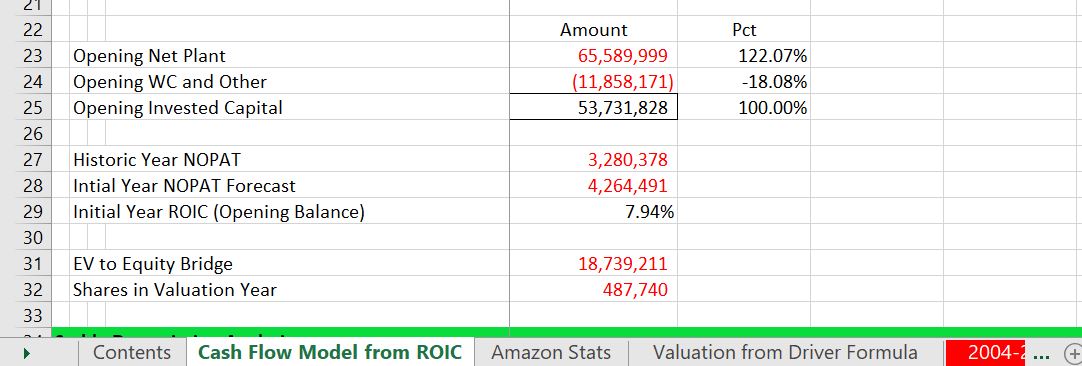
The Amazon model gets data from the financial database. It starts with ROIC and growth and derives the cash flows and values from these inputs. This is a little backwards from the way a typical model works but it demonstrates the key drivers.
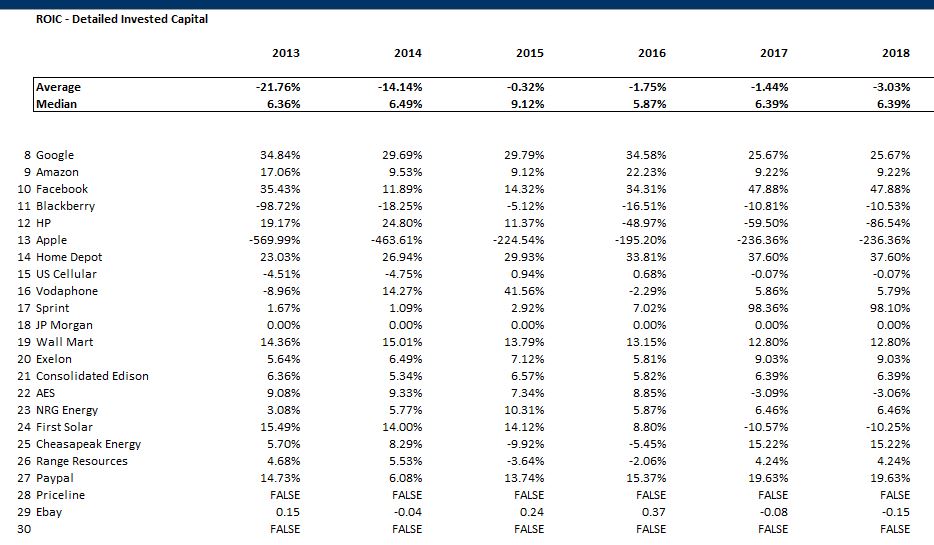
Some of the aspects of this model are illustrated below. The first screenshot illustrates the manner in which historic data can be downloaded from the financial database that is explained at http://edbodmer.com/comprehensive-financial-database/. An example of the historic database is shown below. Note that quarterly data can be annualized in different ways.
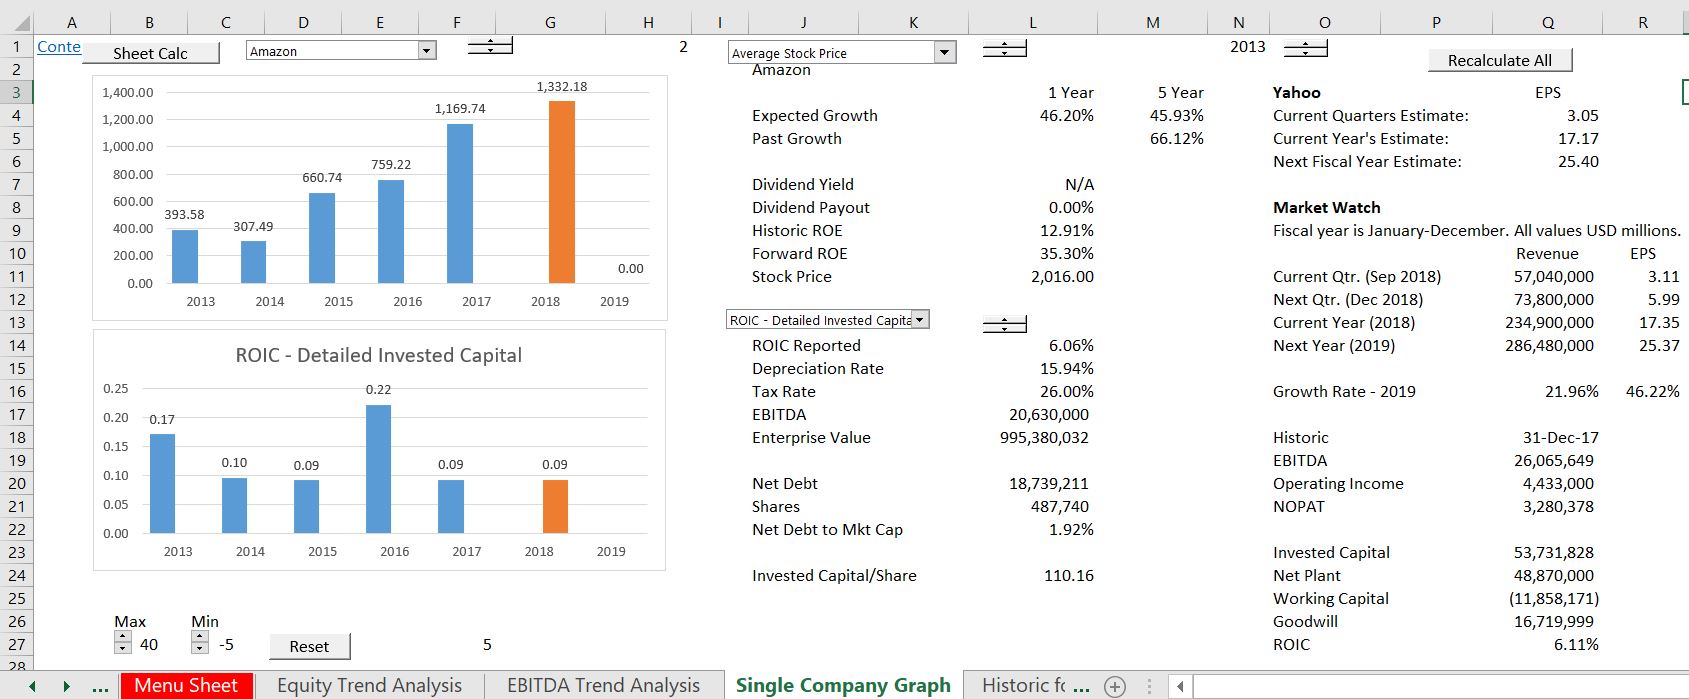
The screenshot below that comes from the financial database shows the stock price graph on the top panel and the return on invested capital on the lower panel. The question is can the ROIC increase and can the company continue to grow.
Implementing the Model with Forecasts of ROIC, Growth and Target Return (WACC)
The model works with the Interpolate Function were you can input different values over time without putting in each value. It also works with a flexible switch where you can
Valuation Outputs from ROIC and Growth Model
Case Study for Your Review
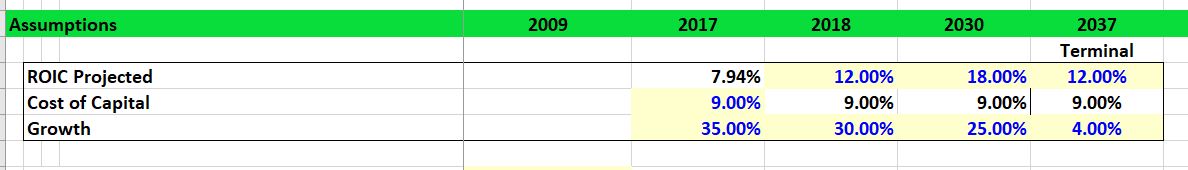
There are two questions below that use a model for Amazon where you input ROIC, growth and WACC to derive the value of the company. You can put different returns and growth various periods (using the INTERPOLATE function). The place you put different inputs is shown in the screenshot below. (Amazon’s share price is about 1770). After downloading the file, you have only the two tasks for this case discussed below.
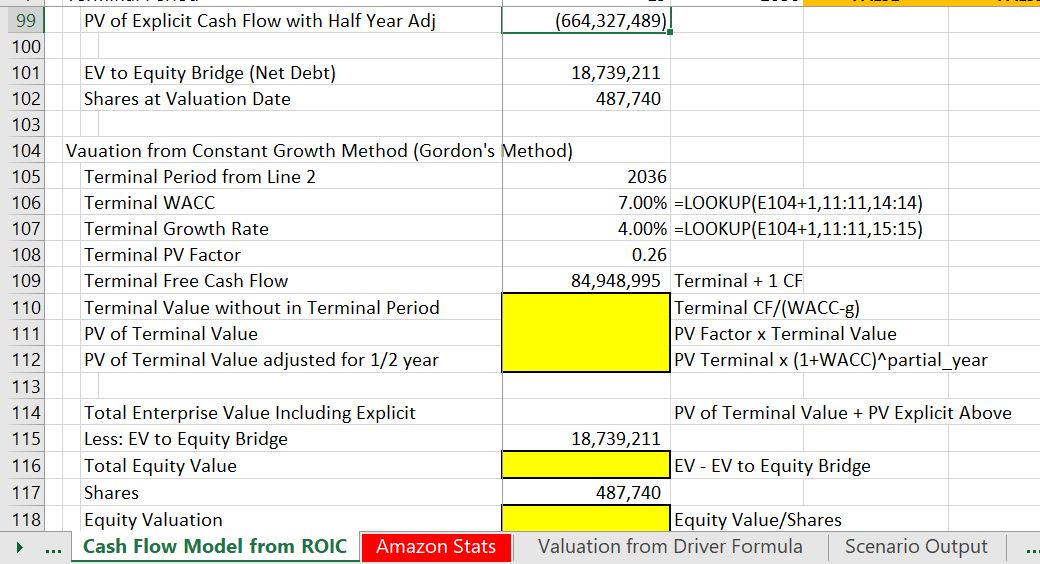
Question 1 – Compute Value
Go the the bottom of the file and fill in the blanks for computing terminal value using (1) the constant growth method; (2) the multiple method; and (3) the value driver method (I have included two variants of this method). The formulas for the methods and the values are given; you just have to fill in a couple of values and come up with the equity value per share. This should make you think about some of the issues we discussed in the corporate finance session. The screenshot below illustrates the blanks that should be filled-in. Look for all of the yellow blanks.
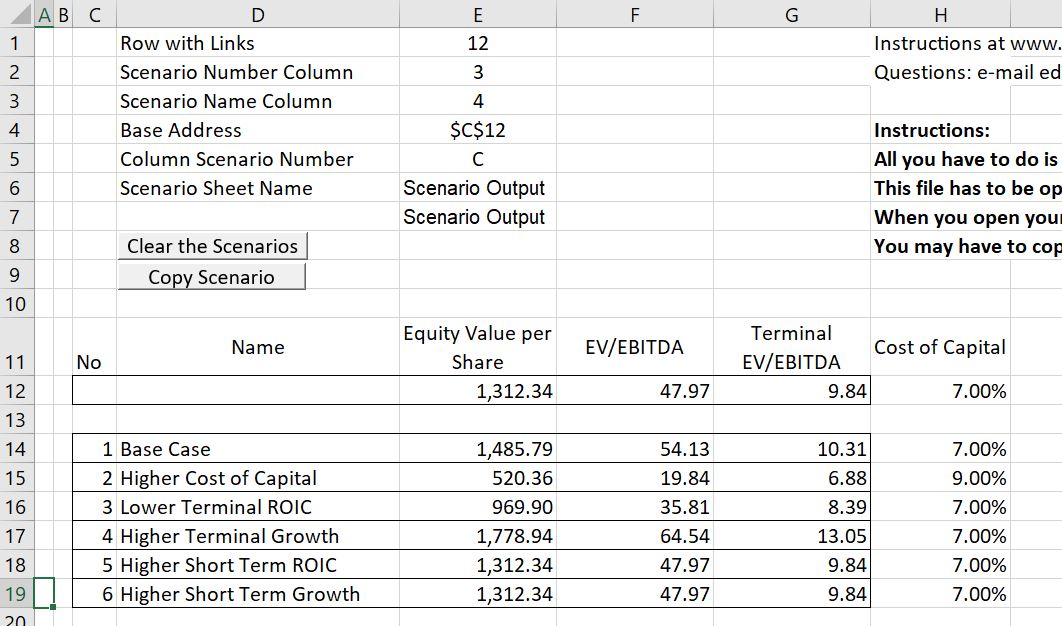
Question 2 – Create Scenario Analysis
Add a scenario analysis to the model and evaluate different values for ROIC, WACC and growth from different periods. To do this you can add a page using the scenario reporter file that you can download below. For this part of the assignment, I have left the scenarios up to you with respect to the factors — just give me about 10 or 20 scenarios with different factors (ROIC, terminal growth, explicit period etc. as explained below). The mechanics for adding scenarios with the scenario reporter are explained below:
- Upload the scenario reporter by pressing the button above
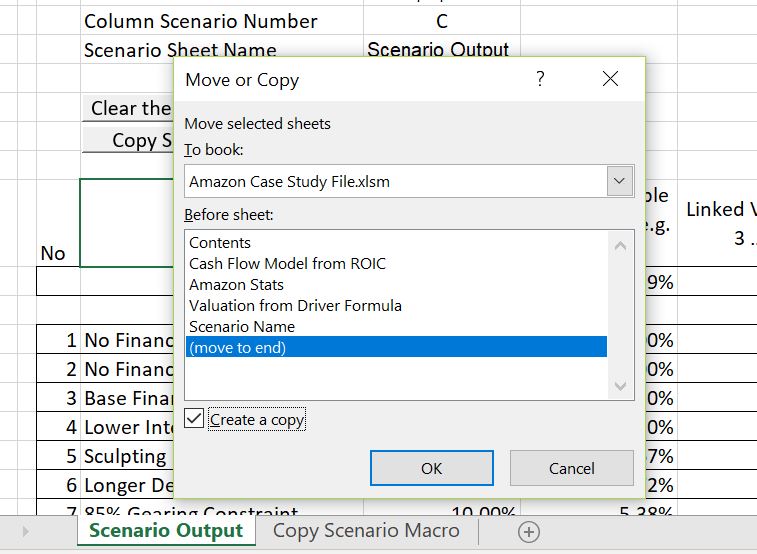
- Move the sheet in the scenario reporter to the Amazon Exercise file (right click on the sheet name and copy the sheet as illustrated below). You can find more details of moving the file at http://edbodmer.com/using-the-scenario-reporter/
- Use the button to clear existing scenarios.
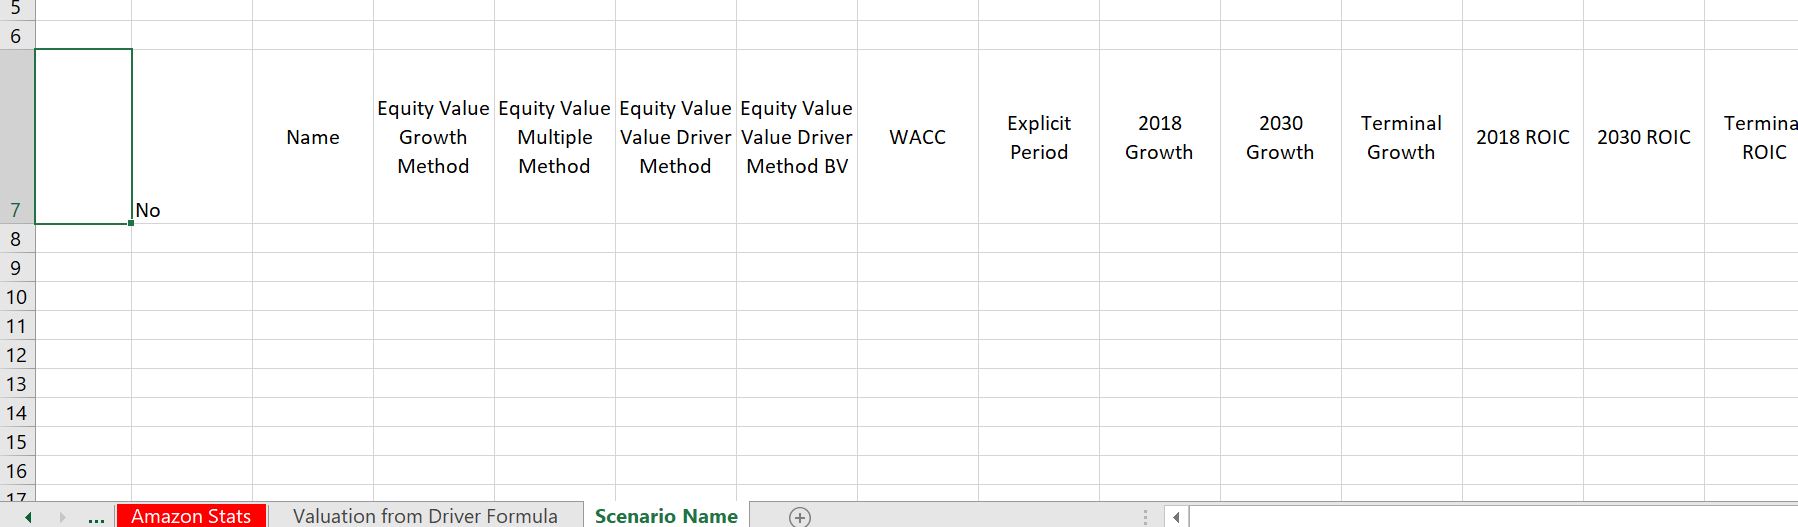
- Now replace the names of the inputs in the “Scenario Output” sheet that should be in your sheet. (Do not close the scenario reporter). Then you should change the default titles that are in the existing file. You can use titles in the sheet named “scenario name” and copy them over the default titles as shown in the two screenshots below. Again, After you copy the scenario sheet into your file, you can copy the titles over the default titles that are given.
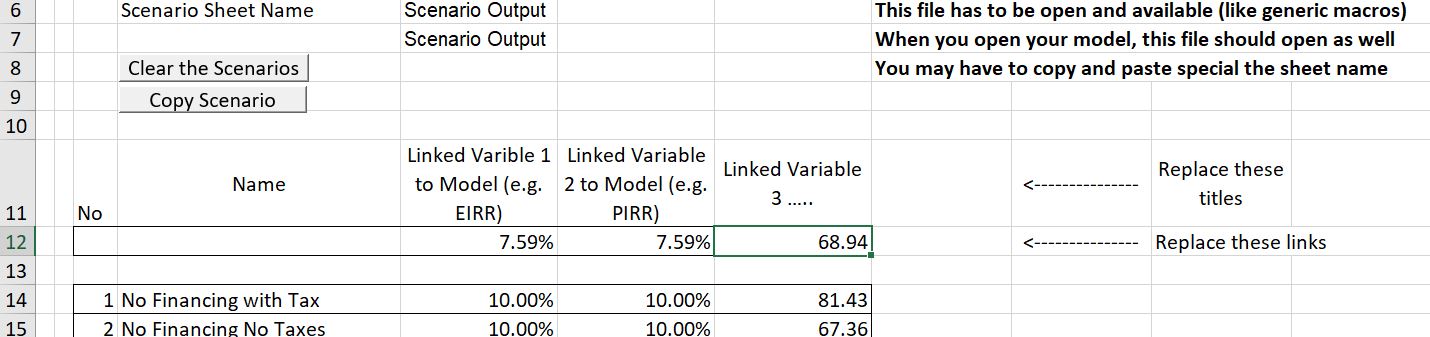
- Copy the macro button to the financial model page and make different scenarios by changing inputs. The inputs that should be changes other than the explicit period are shown at the top of the page an are illustrated in the screenshot below. Make a bunch of scenarios by changing inputs in this table as well as the explicit period.