This page demonstrates how to add a Monte Carlo simulation to your financial model. The process involves writing a little code and then making sure you code can handle large amounts of data. If you have a time series model of the system or the process that you want (for example a price simulation with volatility and mean reversion), the general process is simple. In Monte Carlo simulation, the model must have a component for uncertainty that could is driven by some kind of volatility statistic multiplied by a random draw from a normal distribution. On this page I discuss three approaches to implementing Monte Carlo simulation. The first method is simply to copy the simulations into multiple rows or columns. The second method is to use a blank data table with a count of the number of simulations. The third method is to write a few simple lines of code in a VBA program. A general point surrounding the Monte Carlo simulation is what problem can the simulation solve. As with other issues, my thinking has evolved as I have tried to get the simulations and even reading the data to be quicker.
When I first saw Monte Carlo simulation, I was really excited. It wanted to add it to all sorts of financial models and show off how you could incorporate quantification of real options into valuation. But the more I worked on models, the more I realized that it did not seem to be useful in real problems. I now have come around a little to use Monte Carlo simulation to illustrate problems related to credit analysis and some real options issues. For example, you can use Monte Carlo to show derive the acceptable level of the DSCR. When developing a Monte Carlo simulation, it is easy to see how things work if your time series follow a random walk or Brownian motion. But the conclusions are dramatically different if the economic series follows a mean reverting process like most things in the world. I address computation of mean reversion which is very important in other pages. I suggest a method where you use Monte Carlo simulation with alternative mean reversion parameters to derive the appropriate value.
Looking at Code if You Don’t Want to Read all of My Blah Blah Bhah
The code below is something I have developed the works much faster than the other methods. It is frustrating that when you set up arrays that will be output, you need to have two dimensions. It is so much faster to make the simulations in VBA and then write out an entire array. I put this here so you can read through some ideas and apply the array ideas. Other points in the code below includes the re-dimension from the size of an array; using the Rnd function in VBA;
Sub math_simulate()
Dim price_sim() As Variant
num_sim = Range("mc_output").Rows.Count
ReDim price_sim(num_sim, 1)

price_sim(1, 1) = Range("price").Value
mean_price = Range("price").Value
volatility = Range("volatility").Value
mean_reversion = Range("mean_reversion").Value
Range("mc_output").Clear

' MsgBox " Mean Reversion " & mean_reversion & " Price Sim " & price_sim(1) & " Volatility " & volatility

For Row = 2 To num_sim
     Norm_S_Dist = WorksheetFunction.Norm_S_Inv(Rnd())
     price_sim(Row, 1) = price_sim(Row - 1, 1) _
         + (mean_price - price_sim(Row - 1, 1)) * mean_reversion
          _ + price_sim(Row - 1, 1) * volatility * Norm_S_Dist

' MsgBox " Norm " & Norm_S_Dist & " Price Sim " & price_sim(Row - 1) & " Volatility " & volatility

Next Row

Range("mc_output") = price_sim

Exit Sub

End Sub
Introduction: Why Monte Carlo can be B.S.
When I first began studying Monte Carlo simulation in the early 1990’s I quickly became addicted to the process. You can make beautiful graphs of frequency distributions, show fancy time series equations and directly associate risks with mathematical statistics (i.e. volatility and mean reversion). I have also noticed that academics like to apply Monte Carlo to many problems so they show how smart they are. More recently I have seen that much of the application of Monte Carlo simulation to finance is rubbish. Incorrect measurement of mean reversion can mess things up and many times Monte Carlo does not really measure anything at all.
I do still believe that Monte Carlo can be helpful in certain situations. For example, if you are evaluating how much a cash flow sweep reduces default probability, you can use Monte Carlo simulation. You could measure the default probability with and without a sweep using Monte Carlo simulation. I also find Monte Carlo simulation useful to prove statistical concepts. I did not really believe the Mean Square Error can be used to add up standard deviation, but with simulation this can be demonstrated. Finally, if you want to demonstrate risks associated with holding different portfolios of short-term and long-term debt, the potential risks can be effectively displayed with Monte Carlo Simulation.
Set-up of Monte Carlo Simulation and Using Simple VBA Program
The following Examples of Models apply that Include Monte Carlo Simulation. These models create time series variable(s) and use a simple macro to apply these in a simulation Framework. I have made a very simple example that you can download by pressing the button below. This is the file used in the simple examples.
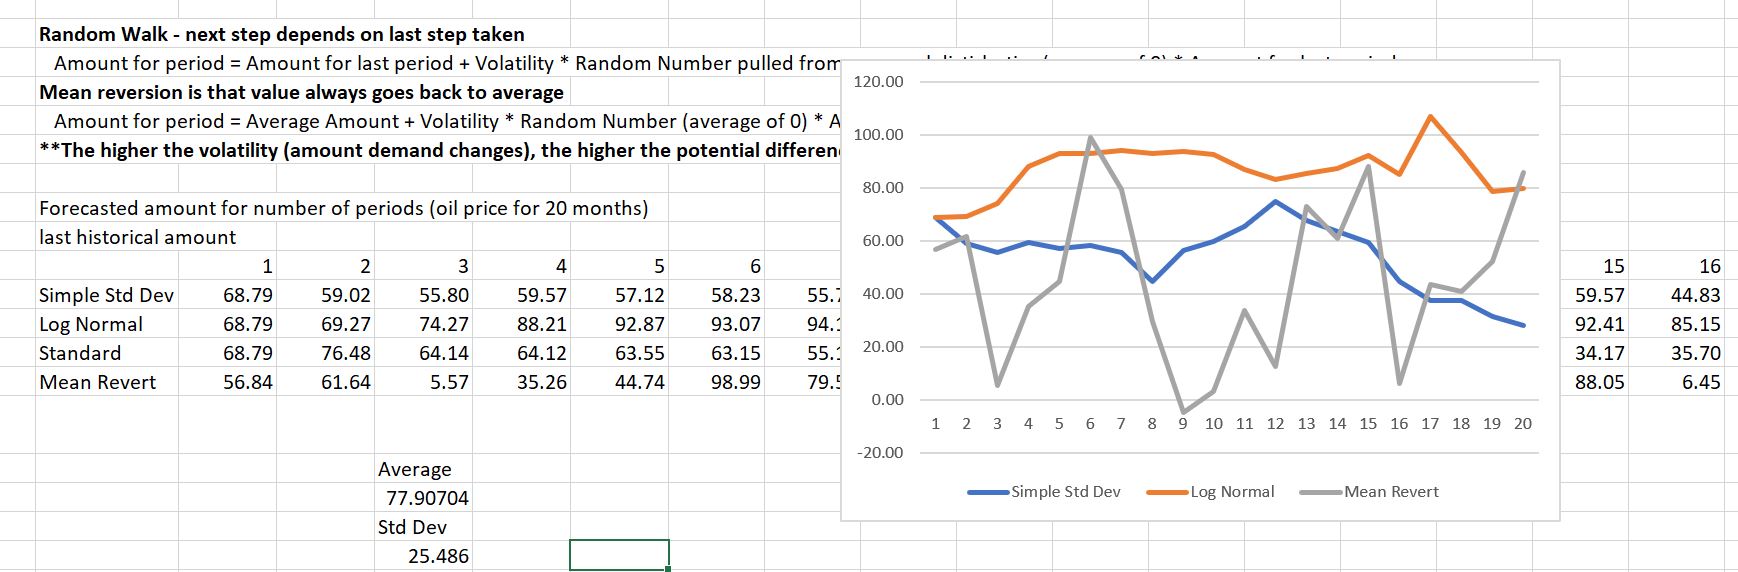
The file includes a few different ways to compute uncertainty and time series equations (these are discussed in much more detail on subsequent pages). These alternative equations are illustrated in the screenshot below. When you press the F9 button to re-calculate, the graphs change. Monte Carlo involves taking one of the values (e.g. the value in period 15) and then recording that value for many different scenarios.
To record the different values, you can do three things.
The first is to simply copy and past the equation to multiple rows in excel. There is no big problem with this, in the simple example. But it the equation is part of a big financial model with many equations, then this not adequate.
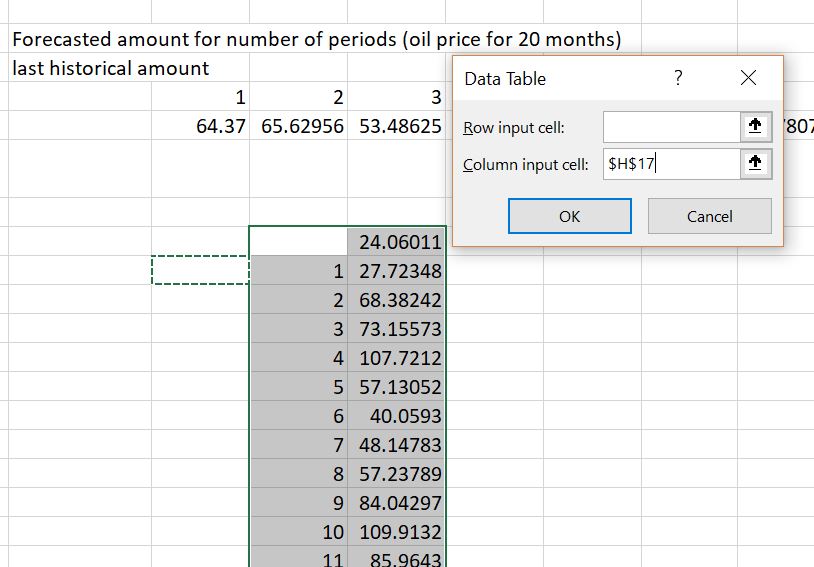
The second method uses a data table to pick a variable. Say you want to pick something out of a financial model like the IRR that depends on the risk built into the equation. This time, you would not want to repeat the entire model. Instead, you could create a data table that has nothing but 1,000 or 10,000 rows or columns. Then when you make the data table, it is just like you are pressing the F9 key 1,000 or 10,000 times. This process that points the column or row input to a blank cell is illustrated below.
The third method uses a little bit of VBA code. You can create a for, next loop together with the cells function. All you need to do is use the cells function to record the different scenarios. The VBA code is illustrated in a separate section below. The VBA code is very simple and more flexible than the data table method.
I think the video below that shows you how to make graphs from Monte Carlo Simulation is not very good. But a lot of people have watched it for some reason
Using a Data Table to Create a Monte Carlo Simulation
Use of a data table to construct a Monte Carlo simulation is illustrated in the screenshot below. In this case note that the column is a simple list of numbers (it could be from 1 to 10,000). The number in above and to the left is simple one of the numbers selected from the time series equation (it could be the IRR, the default, the remaining debt at the end of a project etc.) The column input cell just points to a blank cell anywhere in the sheet (note that it must be the column input cell and not the row input cell).
The video below discusses how to set-up a spreadsheet for creating a Monte Carlo simulation.
.
[wonderplugin_video iframe=”https://www.youtube.com/watch?v=x4bLsnmRjBM” videowidth=600 videoheight=400 keepaspectratio=1 videocss=”position:relative;display:block;background-color:#000;overflow:hidden;max-width:100%;margin:0 auto;” playbutton=”https://edbodmer.com/wp-content/plugins/wonderplugin-video-embed/engine/playvideo-64-64-0.png”]
.
Presenting Monte Carlo Distributions Using the Frequency Distribution
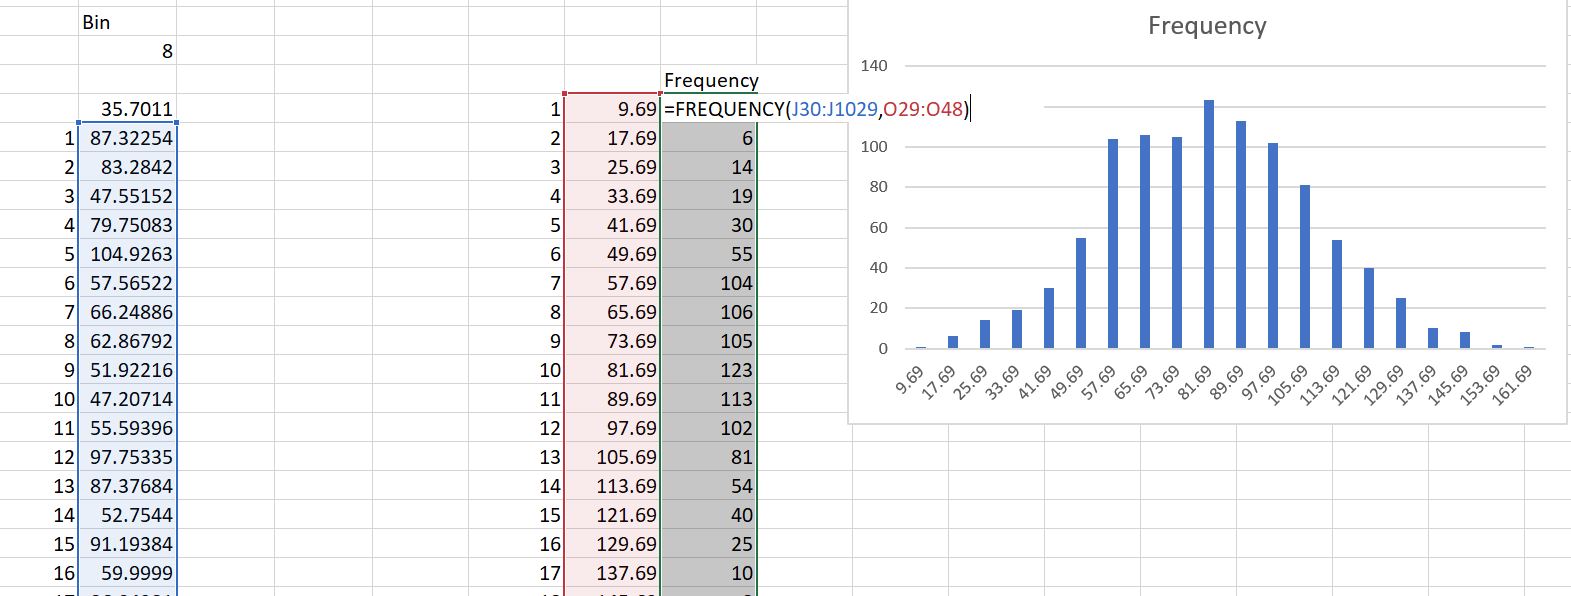
The screenshot below illustrates how to create a frequency distribution from a Monte Carlo Simulation. On the left-hand side, the long series of numbers created from the Monte Carlo simulation is listed (this could be from the data table or from the VBA code). From this list you can find the minimum and maximum and then create and increment (you can also use something like the average plus and minus three of four standard deviations). The increment is the shown in the column starting with 9.69 and increasing by 8.0. Then you can compute the frequency by using the frequency distribution. You can select the area next to the increments or bins and then put in a formula for the frequency distribution. You need to enter the long list of numbers and then the bins. As this is an array function, press SHIFT, CNTL, ENTER to get the result.
Monte Carlo Exercises
The exercises in the files help you walk through how to add a Monte Carlo Simulation to your financial models.
The first two simple exercises begin with a simple Monte Carlo simulation created without a macro below.
The next exercise performs a similar Monte Carlo simulation using Brownian Motion, but uses a simple macro to perform the simulation.
The third exercise includes mean reversion and price boundaries in the Monte Carlo simulation.
The fourth exercise includes correlation among variables in the simulation.
.
[wonderplugin_video iframe=”https://www.youtube.com/watch?v=rOVNH7TWOaU” videowidth=600 videoheight=400 keepaspectratio=1 videocss=”position:relative;display:block;background-color:#000;overflow:hidden;max-width:100%;margin:0 auto;” playbutton=”https://edbodmer.com/wp-content/plugins/wonderplugin-video-embed/engine/playvideo-64-64-0.png”]
.
Application of Monte Carlo in the Context of Cash Sweeps
7. Cash Sweep and Covenant Analysis Monte Carlo Simulation.xlsm
Commodity Price Model with Monte Carlo Simulation.xlsm
Petrozuata – Finished Simulation.xlsm
To add Monte Carlo Simulation to your financial models, follow a two step process:
- Run the Monte Carlo simulation for one or more input variables in the cash flow model (e.g. oil prices, gas prices and interest rates). This file allows you to incorporate Monte Carlo simulation with mean reversion, price boundaries, price jumps, correlations and other factors to any input variables
- Save the Monte Carlo results in a summary file by running the “strip files” macro
- With the original financial model open and the summary Monte Carlo file open, select the Simulation Template Model
Monte Carlo Comprehensive.zip
Simulation Template.zip
.
[wonderplugin_video iframe=”https://www.youtube.com/watch?v=2mLJEo2ubsw” videowidth=600 videoheight=400 keepaspectratio=1 videocss=”position:relative;display:block;background-color:#000;overflow:hidden;max-width:100%;margin:0 auto;” playbutton=”https://edbodmer.com/wp-content/plugins/wonderplugin-video-embed/engine/playvideo-64-64-0.png”]
.
[wonderplugin_video iframe=”https://www.youtube.com/watch?v=_oVz9TT6a5g” videowidth=600 videoheight=400 keepaspectratio=1 videocss=”position:relative;display:block;background-color:#000;overflow:hidden;max-width:100%;margin:0 auto;” playbutton=”https://edbodmer.com/wp-content/plugins/wonderplugin-video-embed/engine/playvideo-64-64-0.png”]
.