This page has exercises and other files (utility files and database files) that I use for merger and acquisition courses. The exercises in file below include both a completed case and a case with selected blank equations. In delivering the renewable course I have created practical exercises where you can get your hands dirty and see how some of the key concepts work. In creating the exercises, I have included the titles for in excel models so you do not have to waste your time typing data. I have left blanks on selected equations that I think will be helpful in understanding the concepts. For example, in the first exercise, I think it is important to understand that you should compute the value of synergies on an after tax basis and that you cannot use the same discount rate for synergies as for other items. To see how this works, you fill in equations for a very simple financial model with and without inflation. The exercises below cover both economic issues like the synergies and a host of different valuation issues. The valuation issues cover issues that include creation of a simple financial model to demonstrate the proof of levelised equations; equations that demonstrate the importance of debt sizing and debt structuring; exercises that show how risks as measured with P90, P99 etc. are computed and can affect the debt structuring.I have created a few basic acquisition and merger model exercises if you are just starting out. As with other subjects, I have included videos along with the exercise files.
Power point slides that cover different sessions of the course are available for download by clicking on the button below. The sections of this webpage follow the same structure as the power point slides. The first section discusses alternative valuation and cost/benefit methods with presentation using football field diagrams followed by synergy and premium analysis.
.
Power Point Slides for Merger and Acquistion Course with Covering Valuation Concepts and Appliations
.
I have included two files that are used to make the excel exercises work more smoothly. The first is a file called Read PDF which allows you to grab data from PDF files and then convert the data to excel files. To run this file you copy stuff from the pdf file and then operate the macro with SHIFT, CNTL, A. When you copy data from a PDF to excel, make sure that you copy and paste special as UNICODE text. There are different formats that you can use to resolve the PDF. If you are reading from the Lazard LCOE stuff you can use the first green box. If you are reading from the PVGIS you can use the second green box.
The second file is a file that has a whole lot of macros to prevent you from wasting time on formatting and copying formulas to the right. This file is called GENERIC MACROS. I have revised the generic macro file in the link below so that you are not prevented to open it because of something called the auto open — a macro that operates when you open the file and excel considers dangerous. When working through the exercises, it would help a lot if you have this file open and enable the macros. The big things that this GENERIC MACRO allows are to press SHIFT, CNTL, R to copy to the right and also CNTL, ALT, C to open the window that has a whole lot of formatting options. There are a lot more utility macros in the GENERIC MACROS file. You can go to https://edbodmer.com/excel-utilities-and-backpack/generic-macros-file/ and see some of the other stuff including a few user defined functions.
.
.
.
.
Part 1: M&A Screening and P/E Ratio Interpretation
.
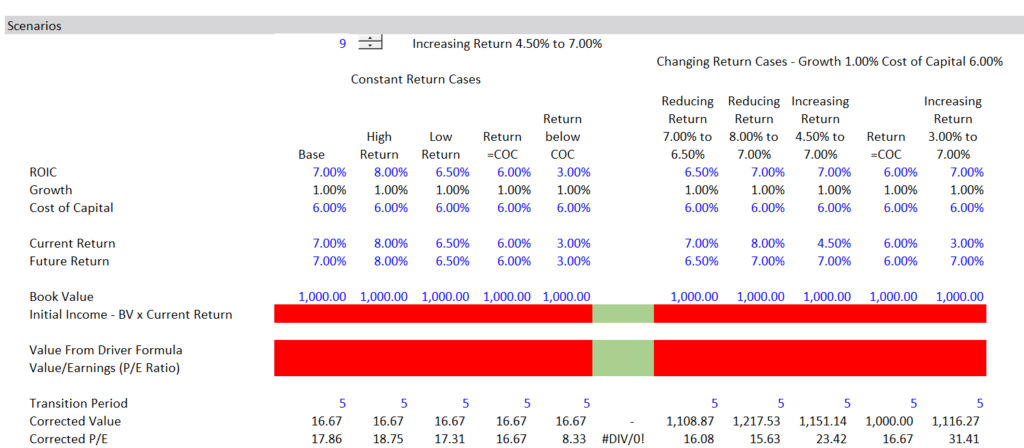
The first part of the course works through issues associated with measuring the costs and benefits of mergers and acquisitions. This exercise uses an illustration of computing the value driver formula. In the case you fill in the value driver formula to see how it works and how it does not work in cases where the return changes over time.
.
.
Instead of presenting a formula that may seem to be a black box, I work through a tiny bit of algebra with two basic finance equations. The first is the classic perpetuity formula and the second is the growth formula. You can prove that a cash flow taking to perpetuity is the next period cash flow divided by the discount rate using an integral formula ∫ert = 1/r. As growth — abbreviated as g — is like a reduction in the discount rate (abbreviated as k), you can write the formula for value as: value = CF1/(k-g). For a stock, this formula gives you the value per share can be expressed as the dividend per share and (abbreviated as D1) divided by the discount rate minus the growth (this is like the common terminal value formula that I complain so much about). So the first formula is:
Value = D1/(k-g)
A second equation is the basic accounting idea that you need to retain cash to make investments and grow. In the case of your own personal finance, you can consider this your savings along with the return you earn from savings. If you save more, then the value of your savings will grow more. As well as the increase in your savings from investing more, the growth in your savings depends on the future return you will make on the savings. For example, if your investment does not grow, then the income does not grow if the return does not change. For a corporation, this equation can be written as the amount the corporation saves (the same as issuing new equity) by not paying out money as dividends and the return the company generates:
Growth (g) = ROE x (1-DPO)
While these two formulas are the basis for valuation, they are useless in terms of terms used in valuation these days (unlike the 1950’s were nice and boring dividend growth for companies like General Electric, Consolidated Edison and General Foods were the basis for valuation). First, dividends are driven by growth and not the other way around (you do not want companies like Amazon to pay dividends if the company can grow fast and earn a good return) and the focus is on earnings rather than dividends. You can then re-arrange the growth formula and use the fact that dividend per share is the earnings per share (“EPS”) multiplied by the dividend pay-out ratio (“DPO”) to derive the dividends (D = EPS x DPO). This leads to the classic value driver formula where value is driven by return (ROE), growth (g) and the cost of capital (k).
DPO = 1 – g/ROE
Value = (EPS1 x DPO)/(k-g)
Value = EPS1 x (1-g/ROE)/(k-g)
.
.
.
Questions
- Does high growth always increase the value of a company
- Do you want to buy a company that is already earning a high return
- If the growth rate is the same for two companies will the company which a higher return have a higher P/E ratio
- Do you think the P/B or P/E ratio is more effectd by a higher return
- Will a company with a higher return always have a higher price to book ratio
.
Part 2: Database of Comparable Companies for M&A Screening
.
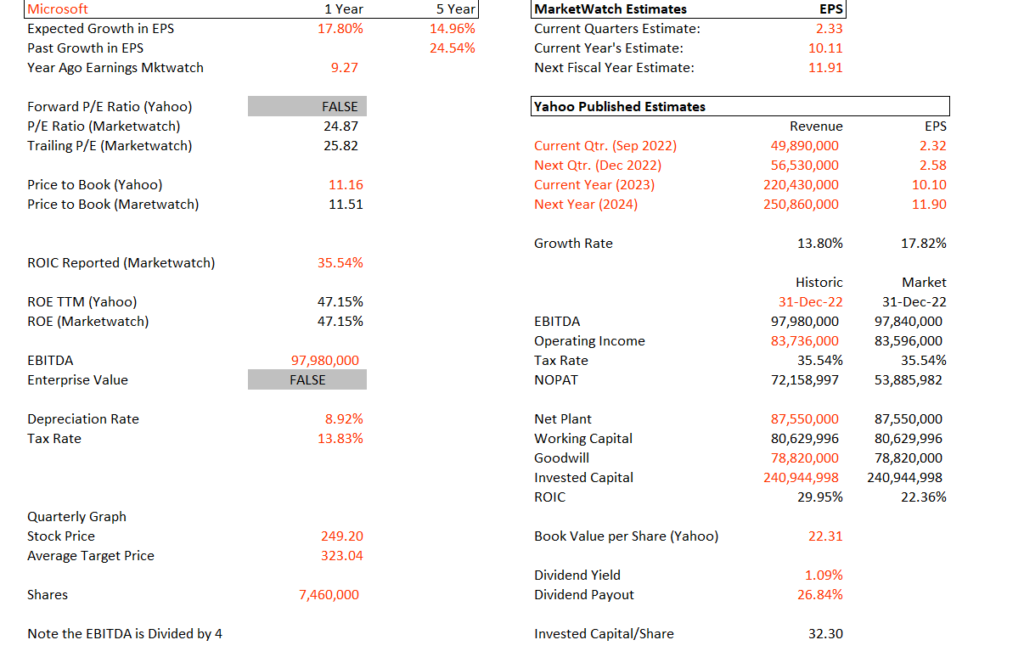
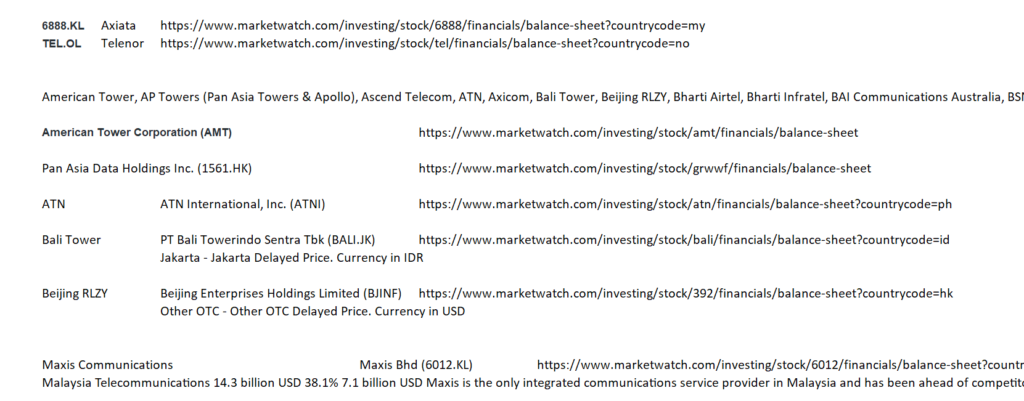
As background, I have created a database with some companies where you can interpret some of the numbers and evaluate how these numbers could affect a simple screening in your brain to see if you think the companies would be good canidates to purchase. The main idea is to be able to interpret different financial ratios from the standpoint of whether it makes sense in the context of an acquistion.
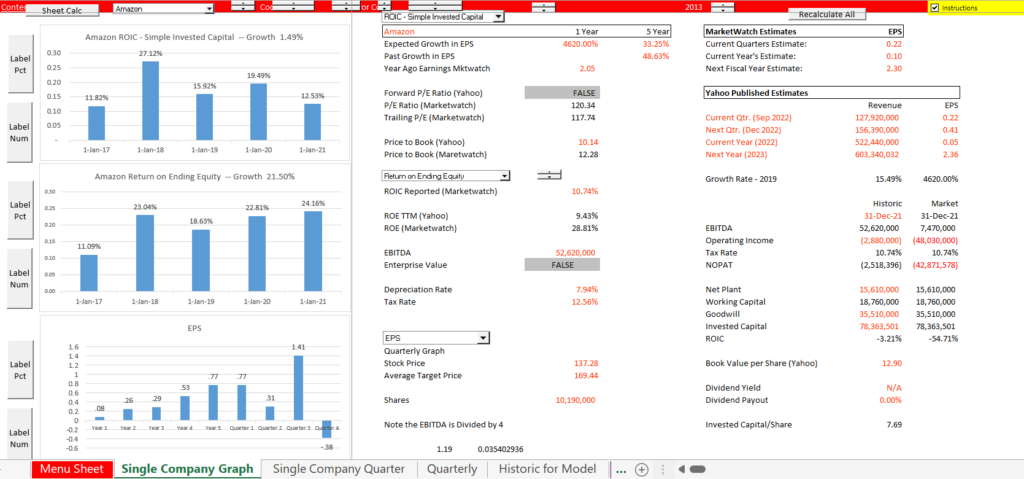
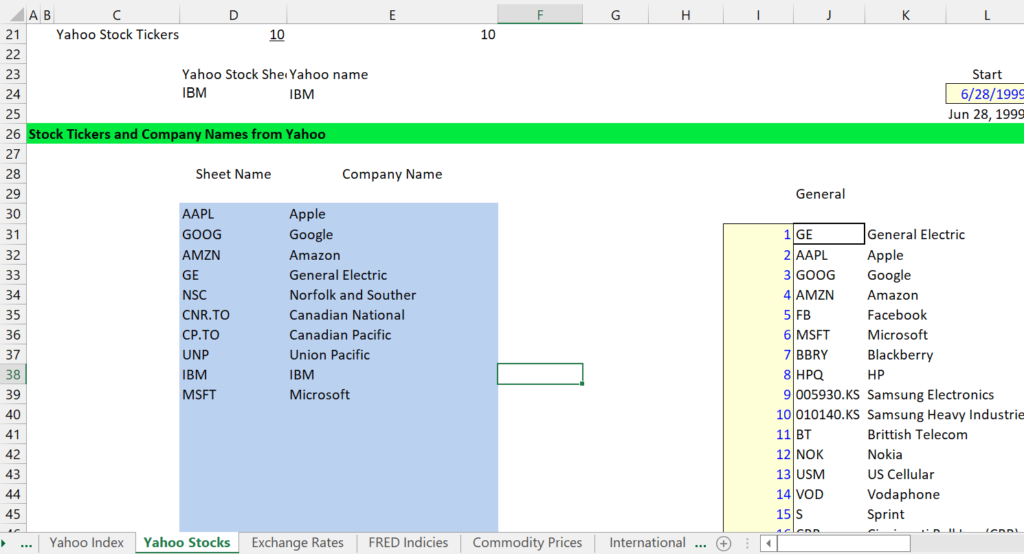
The second file for this section of the course illustrates how to gather data in practice. It is a file that you can use to download financial data and stock prices. You enter ticker symbols from marketwatch and for finance.yahoo for the companies. After that, you can review a lot of financial data with various presentations. An illustration of the output from this database is illustrated below the button.
.
.
.
.
.
.
Questions
- When looking at the database, tell me two ratios that you would concentrate on when looking at different acquistion targets (e.g. ROIC, P/E, P/B, EBITDA growth)
- Do you think it is better to look at the ROE or the ROIC when evaluating a target company
- Do you think it is better to buy a company with a high ROIC or a low ROIC (everything else equal)
.
Part 3: Overview of M&A Analysis and Football Field Diagram
.
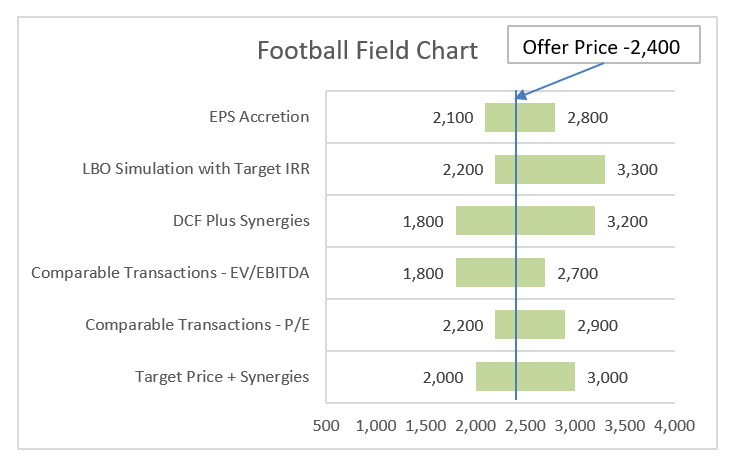
The file and video below provides a general overview of terms for merger and acquisition analysis. Some of the valuation issues are addressed in the context of a football field diagram. There are two exercises below that are associated with the overview section. The button is attached to a file for creating a football field diagram yourself. The football field diagram is illustrated below.
.
.
.
The second exercise is a few questions to assure your understanding of some of the fundamental concepts. It is structured as a quiz. You can download the questions by clicking on the button below.
.
.
Questions
- What is the benefit and what is the cost in football field diagram
- What is your favourite method for valuation
- What are the assumptions in the football field can cause the largest variation in value
.
Part 4: Synergies and Premium in Merger and Acquisition Analysis
.
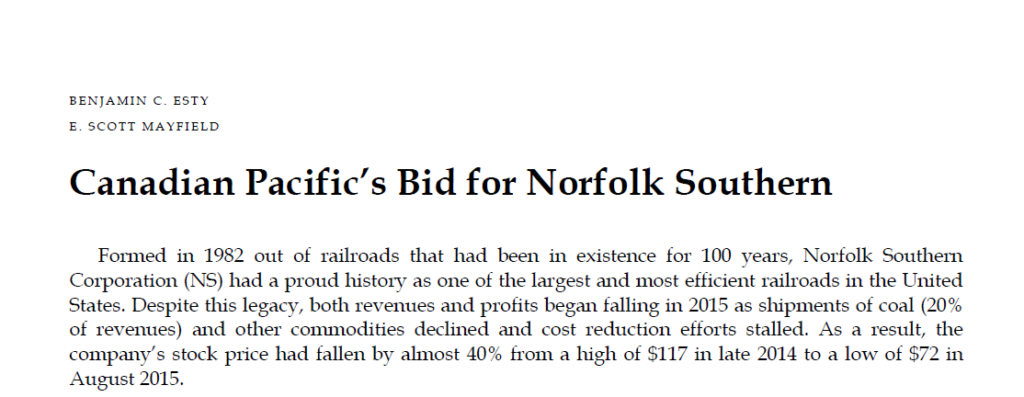
The second set of exercises works through issues associated with measuring the costs and benefits of mergers and acquisitions. This case uses a case study that includes estimates of synergies and alternative measures of the premium in a merger. The case study is the Norfolk and Southern case where Canadian Pacific attempted to take over Norfolk Southern. The general idea is to compute the value of synergies and the value of the premium.
.
.
The file attached to the button below includes data from the case (I am not allowed to put the pdf file on the website. The data includes the stock prices before and after the merger as well as financials. I use the case for a lot of stuff. One thing is making a valuation of the company. Another is to evaluate whether the premium and synergy is reasonable.
.
.
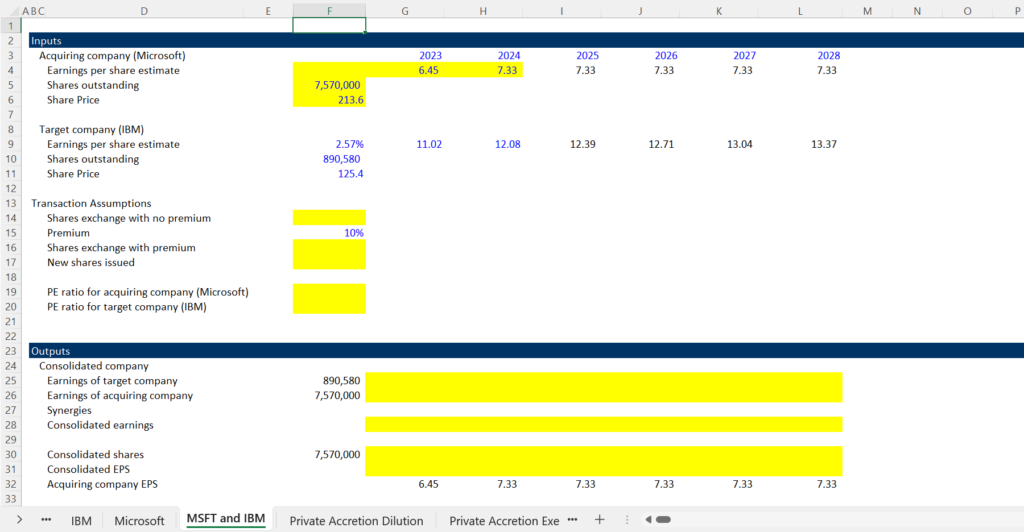
An example of items in this exercise is illustrated in the screenshot below. The exercise illustrates how to work through issues associated with mergers using exchange of shares.
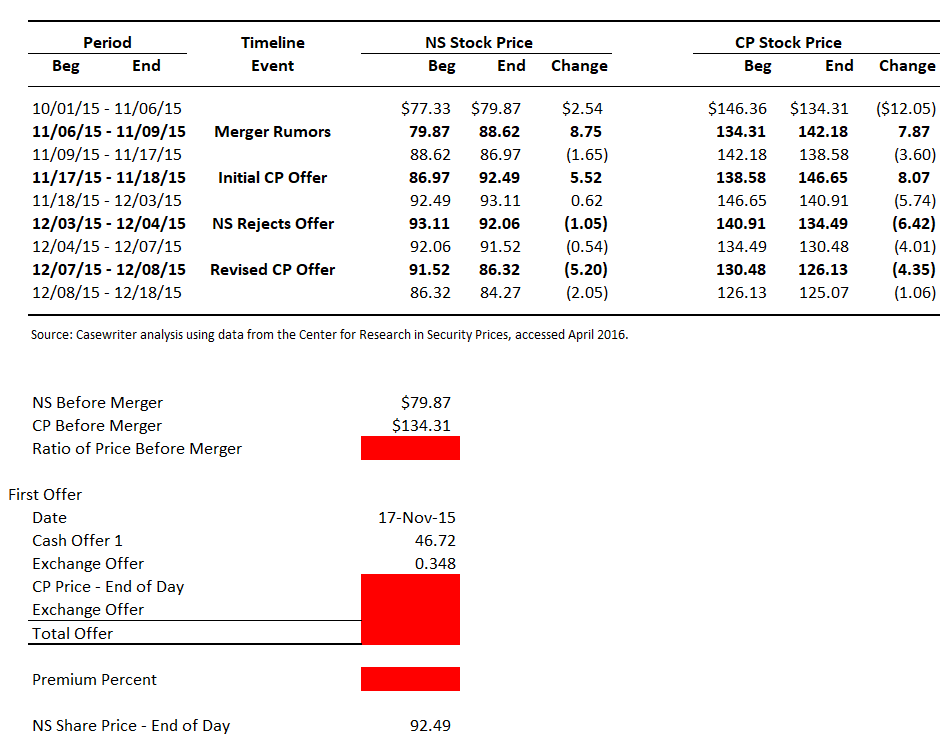
An example of how this case is used is shown in the screenshot below.
.
Questions
- Do you think the discount rate for synergies should be the WACC
- Do Synergies have an indefinite life
- Do you think that you can compute actual syergies earned
- Do you think NPV is the correct way to compute synergies
- Is there a standard way to compute synergies
.
.
Part 5: Purcahse of Project Finance Assets
.
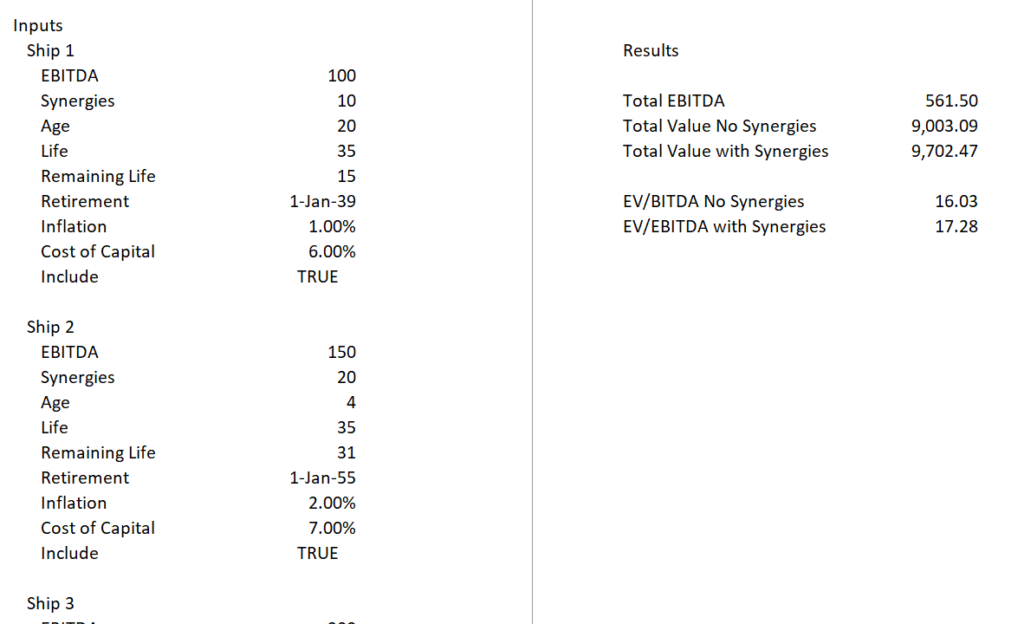
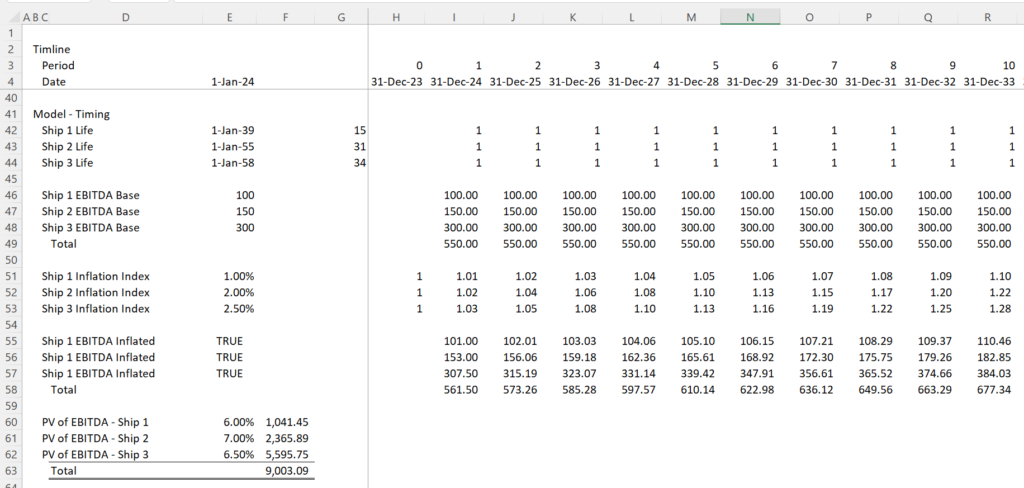
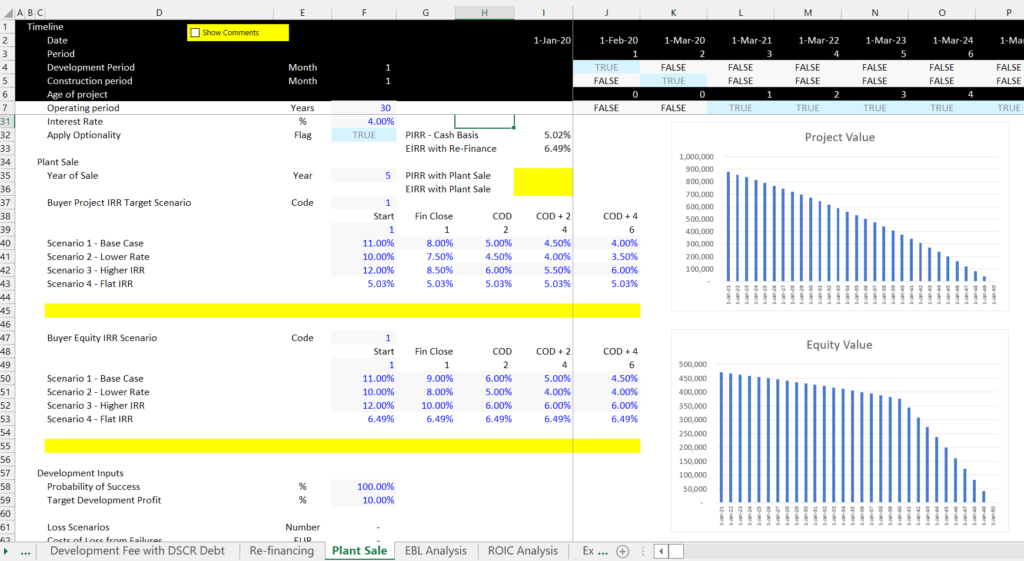
This part of the M&A analysis addresses valuation if you are purchasing project financed assets such as solar projects, ships or other larget investments with a defined life. In this case the value depends on th remaining life of the assets. Further the syndegies and premium may be different for the different assets. The case below demonstrates with a simple example some of the ways that you could analyse this kind of transation.
.
.
.
.
.
Questions
- How does the remaining life affect the EV/EBITDA Ratio
- Does this analysis of individual ships mean that companies with old assets should have a lower EV/EBITDA ratio
- Do you think different assets should have different discount rates
- Do you think synergies have an indefinite life when purchasing this kind of asset
.
.
Part 6: Accretion and Dilution Analysis
.
This part of the M&A analysis addresses accretion and dilution with a simple exercise. This includes a case for acquisition of a public company with forecasts (I use Microsoft buying IBM because the companies have growth in EPS Forecasts). This is considered very bad by academia but illustrates the general idea. Note how the analysis depends on the P/E ratio and not the synergy or premium.
.
.
.
Merger and Acquisition Exercise for Accretion and Dilution with Public and Private Company Example
.
.
Questions
- How do earnings affect the stock price – a lot
- If a company has higher projected earnings per share does the stock price go up
- What is wrong with the accretion and dilution analysis
- Can you compute accretion with other items .
.
.
Part 7: Pro-Forma Balance Sheet and Accounting in Acquisition
.
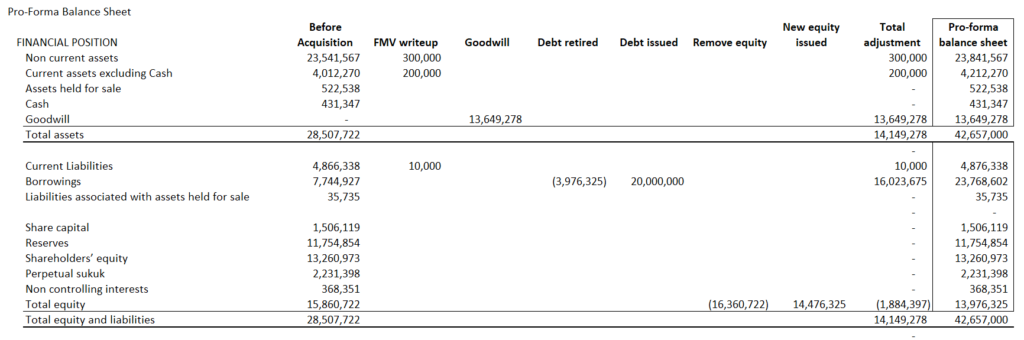
The tenth part of the M&A course addresses pro-forma balance sheets in establishing the financial model after the acquisition. The pro-forma comes from a goodwill analysis and a sources and uses of funds calculation. This can be evaluated with two exercises below.
.
.
.
.
.
Part 8: Financial Modelling for M&A
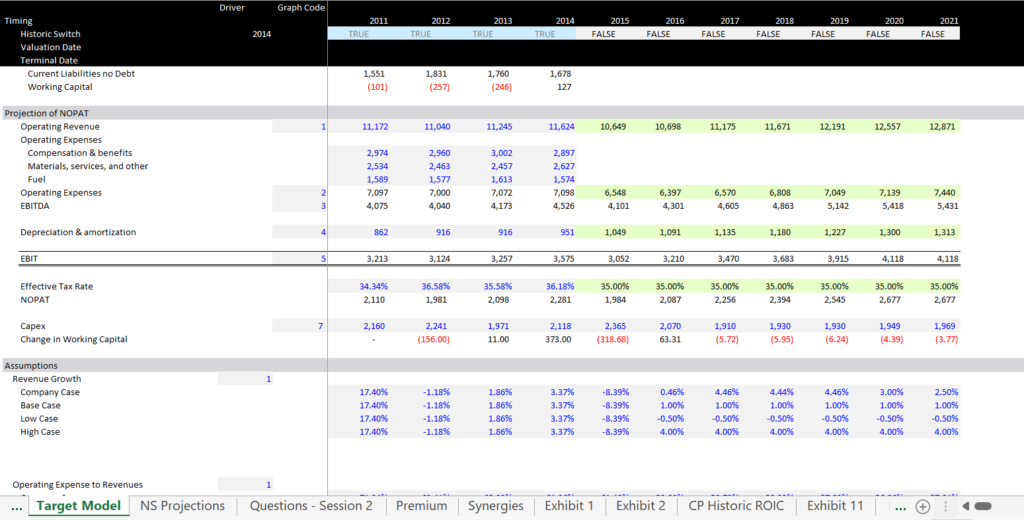
The fifth part of the M&A analysis addresses financial modelling of corporations. For this case I use the Burton Sensors case which is commonly used in business schools for evaluating valuation and M&A issues. This case has an example of a horrible financial model that should must be fixed. It does not have anything about return on invested capital and it uses arbitrary multiples.
.
.
I have included two files for the Burton Sensors case. The first file is the one associated with the case that was provided. This file has the horrible model with no ROIC and a very poor structure. The button which is attached to the second file has the revised model with some blanks you can fill in.
.
.
.
.
Part 9: EV/EBITDA Multiples in M&A
.
The fifth part of the M&A analysis addresses how to evaluate the EV/EBITDA that is fundamental to so many issues in M&A. I demonstrate that the EV/EBITDA is affected by the economic lifetime of assets — how long it takes to before the assets must be replaced. This is in addition to the return on invested capital, the growth rate and other factors including the income tax rate.
The file below is an exercise where you work through the calculation of Enterprise value with different growth rates, different asset lives, different tax rates and different working capital adjustments.
.
.
.
Part 10: Terminal Value Alternatives
.
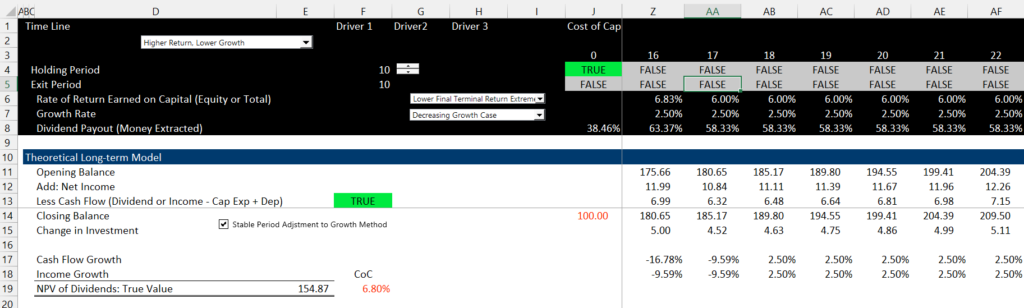
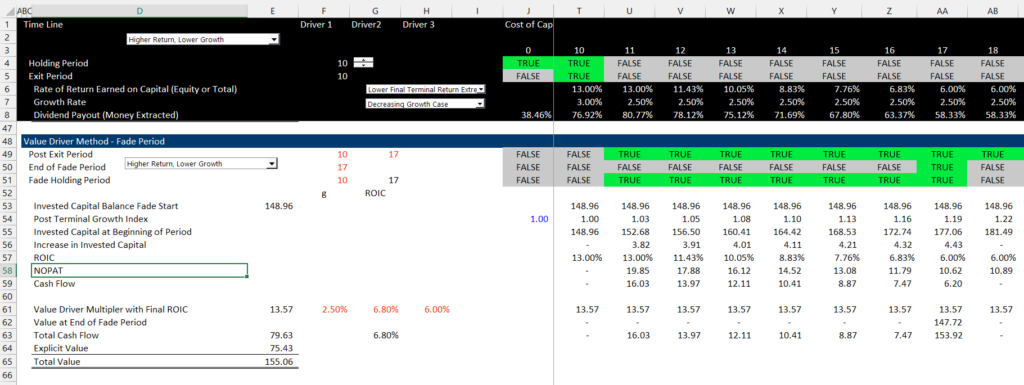
The sixth part of the M&A analysis addresses the important question of different ways to compute the terminal value. The method which is optimal is to compute the Return on Invested Capital with an interpolate function were the current return gradually declines to a long-term stable value. This requires more work than a really simple formula. The exercise attached to the button below illustrates alternative terminal value methods. This works by establishing a proof of the true cash flow over a very long period. This process is illustrated in the screenshot below.
.
.
.
The exercise demonstrates that the method that yields the correct value is a method where a fade period is established. This can then be used to use the interpolate function. With the interpolate function, the change in the ROIC can be projected. This yields the NOPAT. In addition to NOPAT, the invested capital is grown at the transition or final growth rate. The final value is computed using the formula:
.
Value = ROIC x Invested Capital x (1-g/ROIC)/(WACC-g)
.
.
.
Part 11: Leveraged Buyouts and Private Equity in M&A
.
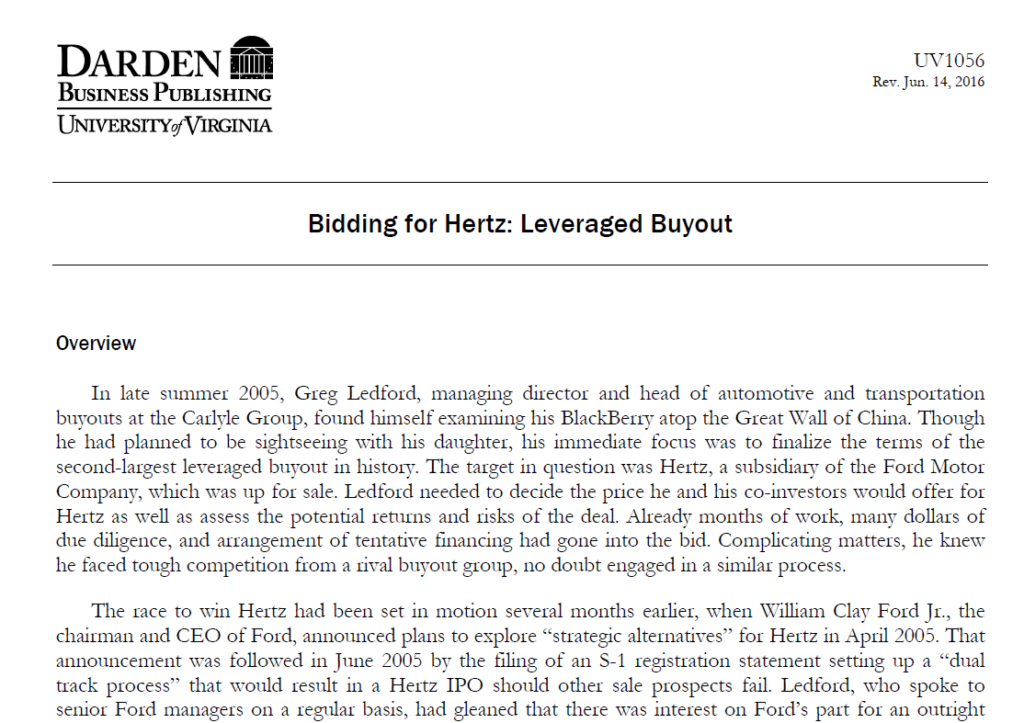
The sixth part of the M&A analysis addresses acquisition of project financed investments. The focus of this analysis is to compute the equity IRR on a project with different levels of gearing or leverage. This part of the course uses the case study of Hertz (which I think subsequently went bankrupt). An excerpt of this case is shown below.
.
.
.
.
.
Part 12: Project Finance in M&A
.
The fifth part of the M&A analysis addresses acquisition of project financed investments.
This part of the course covers more nuanced issues for project finance analysis in the context of M&A. The general idea of this exercise is to demonstrate that the IRR in the initial analysis is just a first step. Because the risk of projects often declines, it is possible to realize upsides when projects are sold. At least in the context of the IRR without the sale. These upsides include use of development fees, use of re-financing and use of the sale of a plant to investors who are interested in paying for safe investments. This third exercise also includes the true definition of IRR, the theory of development risk and development fee; upside option from re-finance; the upside option from selling a project; computing performance measures and equity bridge loans. As with the first exercise, the first file is completed and the second exercise has equations that you should fill in.
.
.
As with the first exercise, the button attached to the first file is the file with equations for you to fill in. The second button is attached to the file with the completed exercise.
.
.
.
.
.
Part 13: Accretion/Dilution and Consolidation
.
The ninth of the M&A analysis addresses accretion and dilution in earnings per share from a merger. I start with a simple case of two public companies, a share exchange and no synergies. This demonstrates the problems with accretion and dilution analysis as well as more understanding of P/E multiples. In this section you also practice real world downloading of financial data. This first part is attached to the button below.
Excel File that Uploads Stock Price Data from Finance.Yahoo Economic Data from FRED using Python
.
.
.
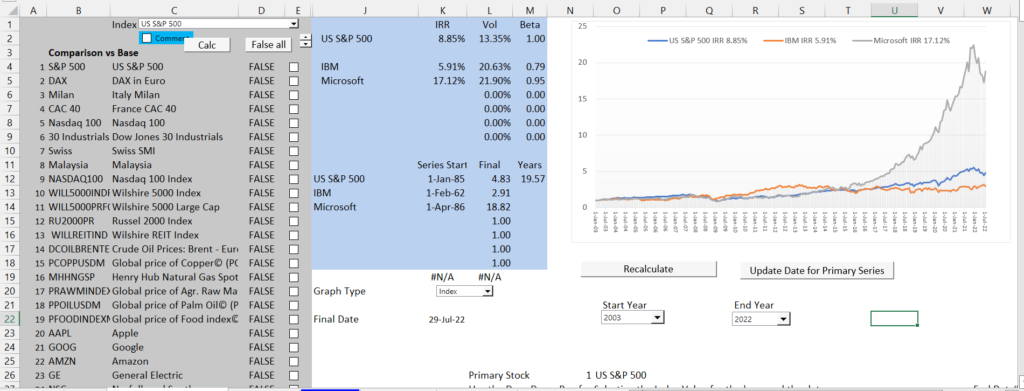
Once you look at stock prices, you can get the financial data for the comparison. In this file you put in the marketwatch and finance yahoo ticker symbols and download the data. I hope you try yourself to download the data with alternative companies including companies that are not US companies.
.

.
.
.
.
Merger and Acquisition Exercise for Accretion and Dilution with Public and Private Company Example
.
Timing Issues in Acquisition Models
The second set of exercises demonstrates how to create a model in which there are different holding periods before which the acquisition is sold. The first model is computed on an annual basis and assumes the sale also occurs at the end of the period. The second model includes more flexible dates and the third exercise (exercise number 5) includes a set of fairly complex functions that allow you to incorporate flexible dates for the transaction date and the sale date as well as growth rates in EBITDA and Capital Expenditures that account for the flexible dates.
[wonderplugin_video iframe=”https://www.youtube.com/watch?v=iAE82CO9lyE” videowidth=600 videoheight=400 keepaspectratio=1 videocss=”position:relative;display:block;background-color:#000;overflow:hidden;max-width:100%;margin:0 auto;” playbutton=”https://edbodmer.com/wp-content/plugins/wonderplugin-video-embed/engine/playvideo-64-64-0.png”]
I am in the process of uploading these files. If you would like to get access before they are uploaded, send me an e-mail to edwardbodmer@gmail.com.
Exercise 3 – Acquisition from Corporate Model with History.xlsm
Exercise 4 – Acquisition Timing and Cash Flow Construction.xlsm
Exercise 3 – Holding Period Exercise – Basic.xls
Exercise 4 – Holding Period Exercise – Including Dates.xls
Exercise 5 – Holding Period Exercise Complex.xls
Structuring Transaction Inputs in Acquisition Models
[wonderplugin_video iframe=”https://www.youtube.com/watch?v=RfN3WXniz0w” videowidth=600 videoheight=400 keepaspectratio=1 videocss=”position:relative;display:block;background-color:#000;overflow:hidden;max-width:100%;margin:0 auto;” playbutton=”https://edbodmer.com/wp-content/plugins/wonderplugin-video-embed/engine/playvideo-64-64-0.png”]
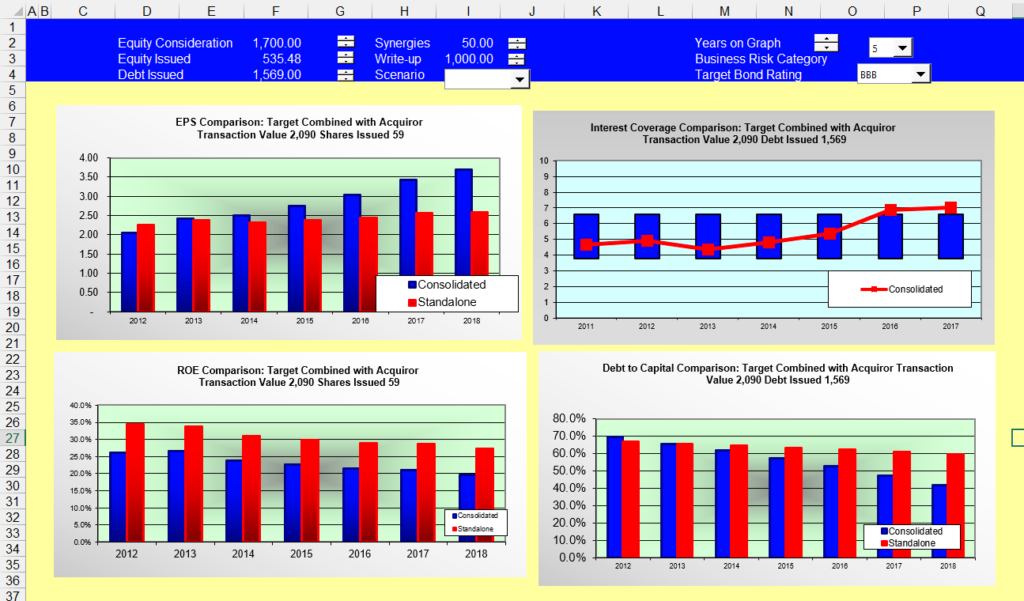
Presentation of Outputs in Acquisition Model
[wonderplugin_video iframe=”https://www.youtube.com/watch?v=IPaj8SUgidc” videowidth=600 videoheight=400 keepaspectratio=1 videocss=”position:relative;display:block;background-color:#000;overflow:hidden;max-width:100%;margin:0 auto;” playbutton=”https://edbodmer.com/wp-content/plugins/wonderplugin-video-embed/engine/playvideo-64-64-0.png”]
Exercise 5 – Acquisition Model Analysis and Outputs.xlsm
.
[wonderplugin_video iframe=”https://www.youtube.com/watch?v=iyJCVB3gBp8″ videowidth=600 videoheight=400 keepaspectratio=1 videocss=”position:relative;display:block;background-color:#000;overflow:hidden;max-width:100%;margin:0 auto;” playbutton=”https://edbodmer.com/wp-content/plugins/wonderplugin-video-embed/engine/playvideo-64-64-0.png”]
The second file and video provide an overview of an integrated merger model where you put two companies together and you set-up a transaction assumption page.
[wonderplugin_video iframe=”https://www.youtube.com/watch?v=b3qjiUE2Dyg” videowidth=600 videoheight=400 keepaspectratio=1 videocss=”position:relative;display:block;background-color:#000;overflow:hidden;max-width:100%;margin:0 auto;” playbutton=”https://edbodmer.com/wp-content/plugins/wonderplugin-video-embed/engine/playvideo-64-64-0.png”]
The file below is in introductory set of slides that reviews general issues associated with mergers and acquisitions including the economic theory of synergies and premiums.
Power Point Slides Reviewing the Theory and Modelling of Mergers and Analysis (Summary Slides)