.
This page is the overview page for levelised cost analysis of different types of investments. You should look at the sub-menus to find the details that are arranged in a more structured manner than on this page. The various menus demonstrate how to find data; how to measure and put together all of the factors that drive the carrying charge; and, how to use carrying charge rates in economic analysis. For the electricity industry and other capital intensive industries different investment alternatives that have alternative operating lives, capital costs, variable costs, fixed costs and risks the LCOE can be an effective way effectively summarise different alternatives. More importantly, establishing carrying charge rates can make the analysis of different alternatives much more effective. The first lesson below walks through different components of the carrying charge that include evaluating project life, inflation, income taxes, deferred taxes, replacement capital costs, debt financing and maintaining a constant capital structure. The carrying charge converts a one-time cost (sometimes referred to as overnight cost) into an annual cost. In addition to carrying charges, comparing investments must evaluate the fixed and variable costs that for electricity include fuel cost. The second lesson set on this page describes how make various calculations that establish the fixed costs and the variable costs that are combined with the capital cost to establish the overall levelised cost.
This page will eventually include a variety of issues involving electricity analysis that includes among other things, coming up with appropriate incentives in different contracts (PPA, EPC, O&M etc) as well as selected issues surrounding distribution, transmission and generation. A subject that I have also include on the page is measuring the LCOE for power projects. As I have made a few videos on LCOE this is the first subject on the page.
.
Reconciliation with Lazard
.
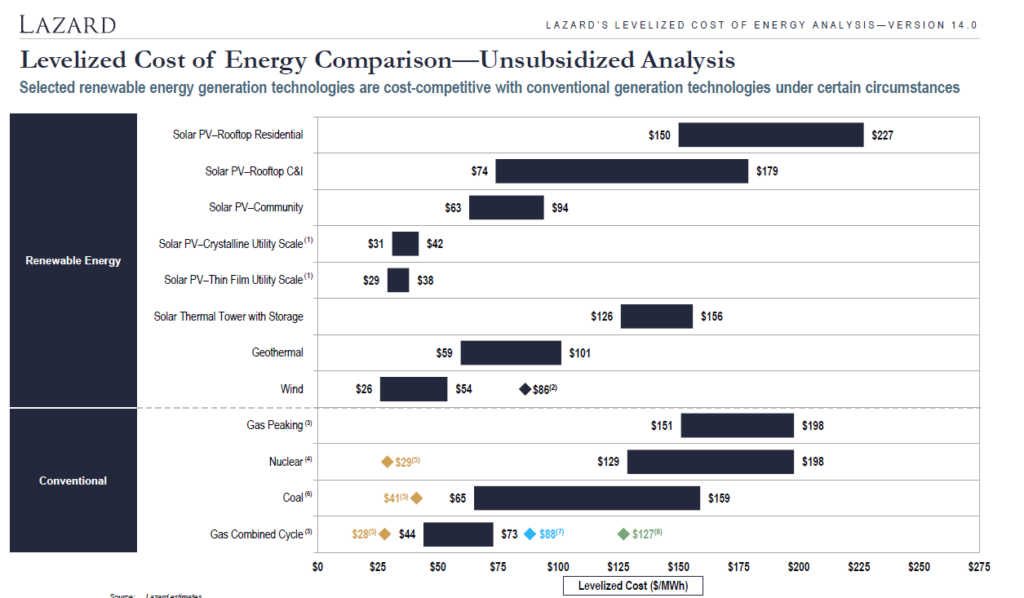
For years now the inestment bank Lazard has published statistics on the levelized cost of electricity. They publish the costs of alternative technologies in a football field diagram. Lazard seems to spend more time on the presentation of graphs and less on the key assumptions that drive the analysis. In terms of the calculations, Lazard does not convert the data into real terms which is essential for economic analysis where projects with different mixes of operating and capital cost are compared (if inflation adjustments are not made, the LCOE favours projects with more operating cost). An example of a football field diagram is shown below.
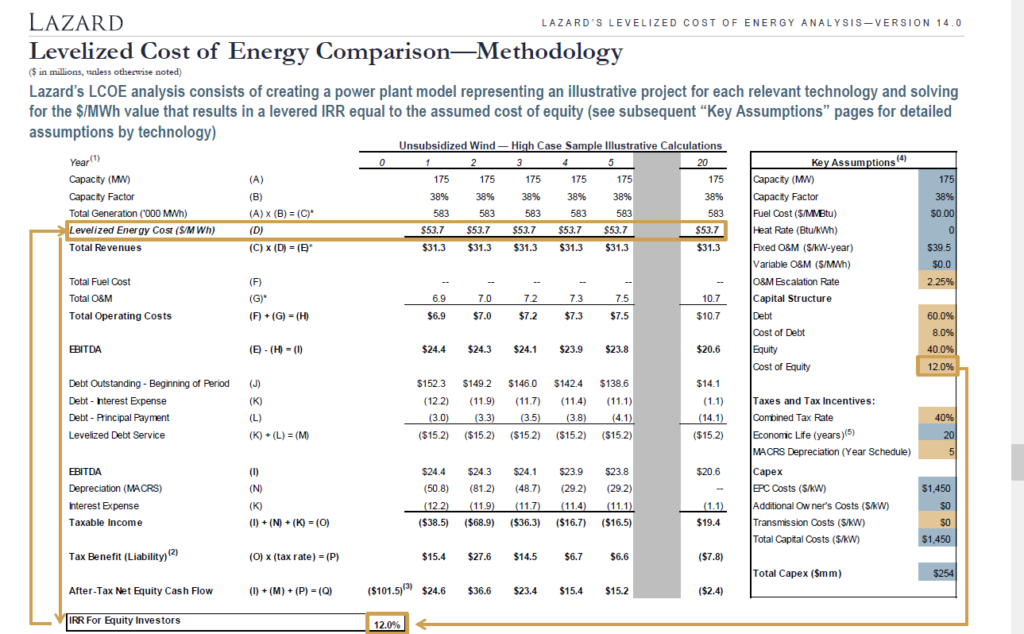
I have worked matching a project finance model and equations that use the PMT and PV functions to compute the levelised cost of electricity. The file attached to the button below includes a data set with the Lazard operating assumptions and many different financial inputs. The file demonstrates the importance of project finance in evaluating the cost structure of capital intensive investments.
.
.
.
.
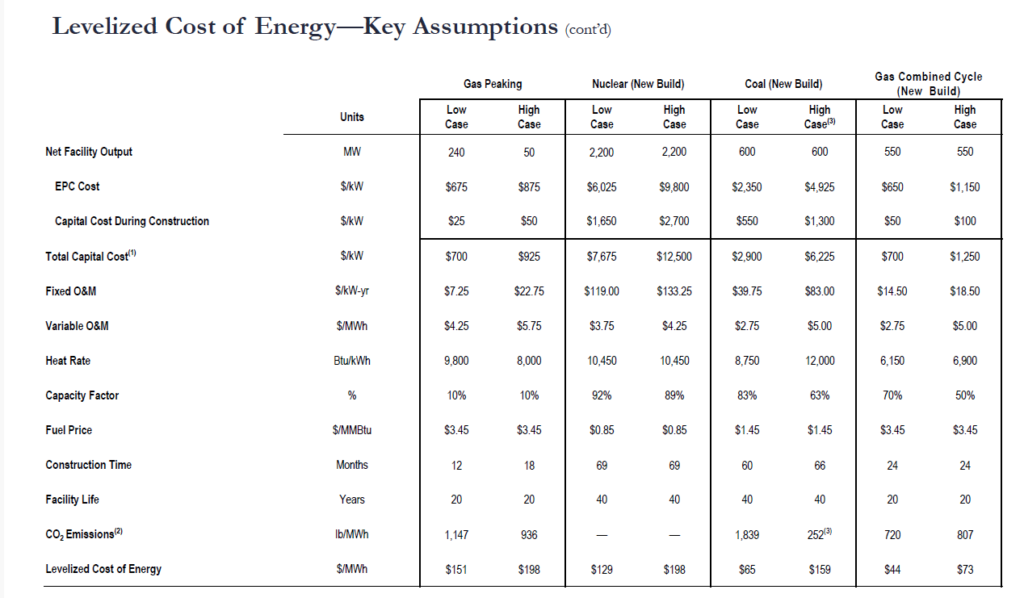
I have reconciled the 129 per MWH in the above graph. This can be done with a formula that takes a couple of steps. The first thing you can do is to go down to the bottom of the Lazard report and find the key drivers of the cost including the capital cost per kW, the operating cost per kW year, the fuel cost and the operating life. The manner in which Lazard presents this data is shown below.
.
.
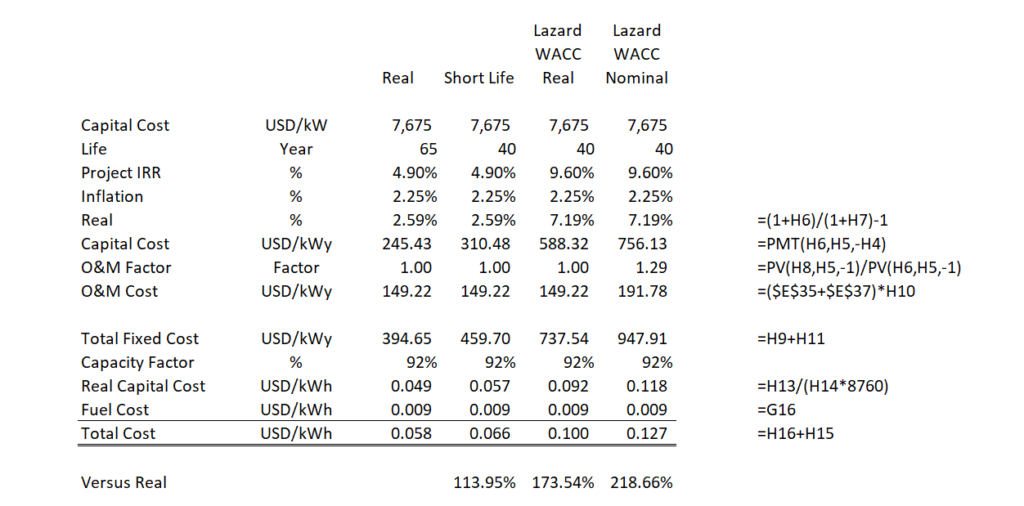
It is essential to inflate the capital cost component as well as the operating cost to be consistent. To do this you can convert the data into real terms using a real discount rate.
.
.
.
Videos associated with Levelised Cost
There are a series of videos that describe the various issues associated with computing levelised cost. I am sure there is one correct method to compute the levelised cost that you can prove with a project finance model that includes re-financing and terminal value. I have no idea how you could watch all of these videos without going crazy. But you may want to tak a look at a couple of them.
If you want the filse associated with levelised cost I have the files in a folder (chapter 5, conventional energy) of the resources. Just drop and email to edwardbodmer.com and I will send a google drive with a whole lot of stuff (probably too much). But you can unzip the files and look for what you want and save the google drive in the cloud….
.
Lesson Set 1: Carrying Charge Rates for Levelised Cost
This lesson set works through calculation of the carrying charges that are used for computing levelised cost of investment. You may think the carrying charge rate is some kind of esoteric concept that is not useful in your day to day work. If you go through this lesson set you will see that the finance, modelling and economic concepts in carrying charge rate analysis are closely related to both project finance and corporate finance.
The carrying charge is a percentage that converts a one time cost that is sometimes called the overnight cost into a level annual cost. (The level cost should be expressed in real terms (i.e. without inflation in constant currency). The lesson set involves using a single capital investment cost and evaluating each of the factors that drive the the conversion of the capital cost into an amount that must be recovered on an annual basis. You can think of this as the amount of revenues necessary to provide a given return to investors. After completing this lesson set I hope you will understand the following things about carrying charge rates:
1. Overview of why understanding carrying charges is important
2. Definition of Carrying Charge Rates — Annual recovery cost to total cost; EBITDA to gross investment; Amount of annual recovery to carry investment
3. Normal Complications in Computing Carrying Charge Rates — Construction Period, Inflation, Required Return on Equity, Tax Policies, Capital Structure
4. Addition Complications of Carrying Carrying Charge Rate — Replacement Cost, Decommissioning and Deferred Taxes
5. Project Finance versus Traditional Approach to Computing Carrying Charge Rates
6. Necessity to Convert to Real (i.e. constant) Currency – Would Need to Compute Present value of the Inflated Fuel Cost using Nominal Currency
7. Tax Issues with Carrying Charges and the Concept that Recovery of Equity Returns can be Evalutated with the Formula: Recovery = Recovery + Recovery x t/(1-t)
8. Deferred Tax Complications whereby Recovery can be Computed through First Calculating the PV of the Tax Shield and then using this to Compute the Payment
9 Adjusting the Overnight Cost for Construction Periods with Both Inflation and Financing Cost. Note the Financing Cost must Include Equity and Debt
10. Evaluating the Effects of Future Replacement Cost that can Occur at Different Periods
11. Computing the Effects of Debt on the Analysis using a Constant Capital Structure.
There are a series of videos that describe each of the adjustments that you can make to derive the carrying charge. The video begins by describing the simple PMT
Videos associated with Lesson Set 1: Computing Carrying Charges
.
There are a series of videos that describe each of the adjustments that you can make to derive the carrying charge. The video begins by describing the simple PMT function that accounts for rate of return on investment and the asset life. Separate videos then move to inflation, tax, depreciation, construction periods, replacement cost and debt. The final video that includes all of the adjustments is explained below. Other videos that walk through each of the financial issues are listed at the bottom of the page. I hope you see how the videos describe many economic and technical aspects of project finance models and to some extent even corporate models. The videos also explain added features of the generic macros that modify colours, links, and sheet structure.
Link to My Youtube Channel Where You Can Look At All of the Different Videos that I have Made
| Carrying Charge Introduction | https://www.youtube.com/edit?o=U&video_id=z9s06nXh7U4 | |
| Carrying Charges and Inflation | https://www.youtube.com/edit?o=U&video_id=9uh8ZN_SHN4 | |
| Taxes in Carrying Charge Rates | https://www.youtube.com/edit?o=U&video_id=n3MWZvnleWg | |
| Periodic Analysis in Carrying Charges | https://www.youtube.com/edit?o=U&video_id=zp06ubSxiGQ | |
| Completed Carrying Charge Analysis | https://www.youtube.com/edit?o=U&video_id=ho2RnSHOWfk |
Files associated with Lesson Set 1: Computing Carrying Charges
There are three files associated with this lesson set. The first file is the completed carrying charge analysis that you can use for economic analyses such as the analysis of batteries, solar and diesel. The second file includes all of the components of the carrying charge beginning with the PMT function and ultimately including effects of inflation, taxes, construction timing, replacement and debt. The third file includes exercises that you can work through in order There are a series of videos that describe each of the adjustments that you can make to derive the carrying charge. The video begins by describing the simple PMT function and moves to inflation, tax, depreciation, construction periods, replacement cost and debt.
Carrying Charge Components.xlsm
Carrying Charges.xlsx
Lesson Set 2: Levelised Cost of Electricity
The second lesson set addresses the issue of computing the levelised cost of electricity. There are a couple of basic things that you should know about LCOE. The first is what the word level means. It just means leveling out the price of electricity so as to get some kind of average. The problems with an average that spans prices over time is that it does not account for two things. The first is the time value of money. The second is the possibility that the amount of generation changes over time. The LCOE that is used in typical RFP’s adjusts for these two factors. But it is still an average over time and it is still an average that is a nominal and not an inflation adjusted real number.
In this exercise, the LCOE is computed for different types of thermal power plants and for renewable energy. The fundamental notion is to add fixed and variable costs together and to express the up-front capital cost on an annual and then an hourly basis using the capacity or availability factor. Before you start, you need the following inputs as illustrated in the excerpt below:
These drivers are the central issue to any LCOE analysis and include (1) capital cost/kW (over night); (2) Fixed O&M cost per kW-year; (3) Variable O&M cost per MWH; (4) Capacity or availability factor; (5) Heat rate for dispatchable plants (MMBTU/MWH); (6) Fuel cost per MMBTU for dispatchable plants; and (7) Carrying Charge rate that converts capital costs into EBITDA that increases over time. The carrying charge rate is the most difficult to work through mechanically. The other factors can be derived from various sources ranging from Lazard LCOE reports to the cost analysis for Chinese coal plants in Pakistan to the using financial models and pvinsights for solar projects.
- Convert the Cost per kW which is the crucial driver of power costs for many technologies by the carrying charge rate. This gives the cost per kW-year. The carrying charge can be thought of as the amount of annual EBITDA required for an amount of up-front cost. It can also be thought of as the return on and the return of capital to carry the investment. It can also be thought of like the loan payment on a house divided by the price of the house.
Annual Carrying Charges = Cost/kW x Carrying Charge Rate
- Add the fixed O&M costs expressed in Amount (e.g. USD) per kW-year to the annual carrying charges to derive the total annual cost per kW-year.
Total Annual Fixed Cost/kW-year = Annual Carrying Charges + Fixed O&M Cost
- Compute the total fixed cost based on energy rather than capacity. To do this, you need the capacity factor (for renewable) or the availability factor for base load (assuming the plant will run whenever it is available). The hours that must be covered by the fixed cost are 8766 x capacity factor. The total annual fixed cost per MWH as the annual cost x 1000 divided by 8766 x capacity factor.
Total Annual Fixed Cost/MWH = Total Fixed Cost/kW-year x 1000/ (8766 x CF)
- Compute the fuel cost as the heat rate expressed in MMBTU/MWH with the Cost (e.g. USD/MMBTU) to derive the fuel cost per MWH.
Fuel Cost (USD/MWH) = Heat Rate (MMBTU/MWH) x Fuel Price (USD/MMBTU)
- Add the variable O&M per MWH to the fuel cost to derive the total variable cost per MWH.
Variable Cost (USD/MWH) = Fuel Cost + Variable O&M
- Add the total fixed cost to the variable cost to derive the levelized cost per MWH.
Levelised Cost/MWH = Total Fixed Cost/MWH + Total Variable Cost/MWH
Notes:
Treat the levelized cost analysis differently for a base load plant and an intermittent low capacity factor renewable energy plant.
For the base load plant measure the avoided cost of unavailable time.
For the intermittent plant with low capacity factor (e.g. solar and low capacity factor wind), measure the levelized cost relative to short-run avoided cost (should include the cost of ancillary services).
For the intermittent plant with a high capacity factor (e.g. off-shore wind and geothermal), could perform a loss of load probability analysis that credits the intermittent plant with some capacity value.
Note that the carrying charge formula is consistent with the formula:
LCOE = NPV(Revenues)/NPV(MWH) when degradation is accounted for in the carrying charges and the carrying charge formula includes inflation. This implies that the carrying charges are computed on a real and not nominal basis if all the fuel and O&M components are inflated on the same basis.
In explaining the general concept of LCOE I describe three general methods as follows:
Method 1: NPV(Revenue)/NPV(Generation)
I start with the formula that is sometimes included in RFP’s which is:
LCOE = NPV(Nominal Revenue)/NPV(Generation)
This method is described in the videos and the files below (some of them have bad background noise, sorry about that). http://www.youtube.com/embed/KPvCT_62Mcc
I then explain that this formula is is the same as the formula for total cost where:
Total Cost = PV of O&M + PV of Capital Expenditure. In this case LCOE = Total Cost/NPV(Generation)
I demonstrate that this formula works only when the discount rate is equal to the PRE-TAX PROJECT IRR.
LCOE Analysis with Database.xlsm
Videos Associated with Lesson Set 2: LCOE Analysis
The file below illustrates how to use carrying charge rate analysis with different electricity technologies. It works through plants that are included in the IEA report as well as in the Lazard analysis and EIA website.
| LCOE Exercise | LCOE Exercise.xlsm | https://www.youtube.com/watch?v=TAnRC8uFrPk | ||
| Solar LCOE with Three Methods | Solar LCOE Model | https://www.youtube.com/watch?v=Sh1w60T7cd4 | ||
| Solar LCOE with Scenarios | Solar Version 3 | https://www.youtube.com/watch?v=KPvCT_62Mcc | ||
Files Associated with Lesson Set 1: LCOE Analysis
Solar LCOE Model.xlsm
Pakistan Capacity Charge Example.xlsx
Lesson Set 3: Indexing and Purchasing Power Parity
This lesson works through calculation of the carrying charges that are used for computing levelised cost of investment. You may think the carrying charge rate is some
| Subject | Excel File | Video Link | Chapter Reference | Page Reference | |||||
| IPP Capacity Charges and Inflation | IPP Capacity Charges.xlsm | https://www.youtube.com/watch?v=nM1_vztq6x0 | 33 | 417 | |||||
| Tradeoff Between O&M and Availability | O&M and Availability.xlsm | ||||||||
| LCOE Exercise | LCOE Exercise.xlsm | ||||||||
| Evaluation of Bids Exercise | Bid Exercises.xlsm | ||||||||
| Capacity Charge Bid Exercise | Capacity Charge Bid.xlsm | ||||||||
| Heat Rate Risk and Availability Risk | Heat Rate and Avaiability.xlsm | ||||||||
| Reading Exchange Rates and Inflation | |||||||||
| Oftaker Costs and PPA Components | |||||||||
| … | ………………………………………………………………………………………. | ….. | ……………………………………………………………… | ….. | ………………………………………………………………………………………….. | …. | ……………………………….. | … | ……………………………….. |
Lesson Set 3: Indexing and Purchasing Power Parity
Lesson Set 4: Comparative Costs of Technologies and Acquiring Data
Cost Benchmarks and Miscellaneous Analyses
Cost Comparison.xls
Cost Comparison from EIA and IEA.xls
Biomass Model Example.zip
Cogeneration Example.xls
Cogeneration Modelling.ppt
Complete with Scenarios.xlsm
IPP Analysis.xlsm
Philippines Analysis.xlsm
Ghana Electricity Analysis.xlsm
Maintenance Timing Exercise.xlsm
Converstion Data.xlsx
Exercise on Indexing Capacity and Fixed O&M.xlsx
Comprehensive Example.xlsm
| Risk | Mechanics of how risk occurs | Mitigation from Mirror Contract | Contract Examples | Theory | Exceptions/Discussion | |||
| Construction Delay Risk | LD penalty in PPA | EPC Contract | Delay LD in PPA Example Thermal’!A1 | Should Reflect the off-taker costs | Limits on Delay in Unconventional Technology | |||
| Delay LD in PPA Renewable’!A1 | Too high delay costs will increase EPC cost | Renewable should have lower cot to off-taker | ||||||
| Delay_in_EPC | Change orders in EPC contract | |||||||
| Cost Over-run | Fixed Capacity | EPC Contract | Multi Part Tariff’!A1 | Allocation to IPP increases cost | Bugangali Plant in Uganda | |||
| Payment or | One Part Tariff’!A1 | Increase in cost higher for more complex | Real question is if tariff is affordable | |||||
| Fixed One Part | EPC Contract Fixed Price’!A1 | Change orders in EPC contract | ||||||
| Tariff at FC | History of EPC contractor and skin in game | |||||||
| Performance at COD | Reduced | EPC Contract | Performance LD in EPC’!A1 | Stricter performance increases costs | Performance test period | |||
| Capacity Revenue | Measuring performance of wind generator | |||||||
| or Increased Cost | Measuring solar performance ratio | |||||||
| in case of heat rate | ||||||||
| Availabilitity | Reduced Capacity | O&M Contract | Availability Penalty’!A1 | High availability increase O&M cost | Nigeria fuel and transmission availability | |||
| Charges in Dispatch | O&M Contract’!A1 | Can use spot market prices | Solar O&M and soiling | |||||
| Reduced Energy in | Different penalties in different periods | Increased risk with spot prices | ||||||
| Renewable | Penalty structure in capacity charge | |||||||
| Fuel Price | Use Public Index | Fuel Supply | Contract Heat Rate’!A1 | Risk only to the for the costs relative to market | TATA Power 4,000 MW Plant in India | |||
| or Actual Price | Agreement | Hedged risk in Merchant | ||||||
| Efficiency | Contract HR in PPA | O&M Contract | Contract Heat Rate’!A1 | Fuel price measured against heat rate | ||||
| One Part Tariff | IPP may pad HR and cause inefficiency | |||||||
| Renewable in energy production | ||||||||
| Transmission Risk | Meter Location | PPA Contract | Curtailment risk in U.S. wind power | |||||
| at Plant or Recipt | ||||||||
| Resource Risk | Reduced Earned | None | Increases effective cost of renewable | Problems with wind resource studies | ||||
| Revenue for | Higher DSCR | Hydro power variability | ||||||
| Renweable | Solar performance ratio evaluation | |||||||
| Exchange Rate Risk | Indexed capacity | Multi Part Tariff’!A1 | Problems with PPP theory | |||||
| and energy | One Part Tariff’!A1 | Can make contract unaffordable | ||||||
| Indexed one part | ||||||||
| tariff | ||||||||
| Interest Rate Risk | No adj for interest | Interest Rate | Hedging ratio may be 60% | With variable inflation can have less | ||||
| rate changes | Swap Agreement | hedging | ||||||
| Hedging depends | Swap agreement can be expensive | |||||||
| on DSCR | ||||||||
| Political Risk | Political Risk | Judge political risk by evaluating | PRI may be difficult to collect | |||||
| Insurance | economics from offtaker perspective and | Understand economics of project | ||||||
| Government | earned equity IRR | |||||||
| Gurantee | ||||||||
| Demand and Supply Risk | Avoided in PPA | PPA | May be converted to political risk | |||||
| Accepted in Merchant | ||||||||
| ….. | ….. | ….. | ……………………………………….. | …………………………………. | ………………………….. | ………………………………………………………………….. | ……………………………………………………………………………….. | ……………………………………………………………………………. |
Integrated Electricity Analysis.xlsm
Nigeria Summary of Gas Outage.xlsx