This article presents actual in variation in energy production from solar, wind and hydro plants on an annual and monthly basis. The idea of this analysis is to think about how projects that are in service vary from year to year instead of using consulting estimates of variation. The source of the data is a U.S. database that tracks monthly production from each electricity facility since the 1970’s. Because of changes in the way the data was presented over the years, it took some work to clean up the database. In this article, I explain how the database can be updated and I present variation in terms of P90, P99 etc. from an actual data perspective.
I have also compiled an analysis of the variability in wind after projects are operating relative to before they are operating.
EIA Updating Instructions for Generation Databases that Evaluate the Variation in Production
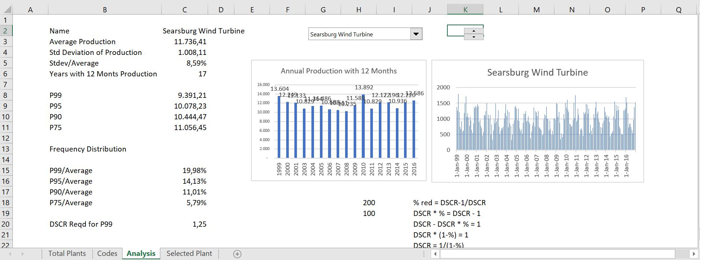
For solar, wind and hydro I have included files that include historic monthly and more importantly annual production for U.S. plants. This is included so you can see the variation in year to year production. You can compare for example the P99 to the annual production to see how much of a DSCR buffer is necessary relative to the average production. This can then be compared to the P90, P75 etc. that is estimated by consultants. The analysis comes from a database named EIA 923 that records month by month production for electricity plants in the U.S. since 1970.
1. Find the file named EIA 923 database. This is an enormous file with data on the generation from each plant in the U.S. from 1970 to the current year. It contains month by month generation by unit. A lot of work was done on this file to get consistent fuel category names and plant names and codes accross years. I have copied the file into a google drive with the following link:
https://drive.google.com/open?id=0B5r4OP_dQLe8Y1JfaUlXZldveGM
2. Go to the EIA 923 database page in the EIA website and find the latest dataset (you can google EIA 923). Open the file and copy it into the EIA 923 database file. If the file is for a new year, then copy the prior year and create a new sheet (e.g. 2018) with ALT,E,M. Make sure the merged cells are removed from the EIA file when you copy a new file. Make sure that the formulas in columns A-C of the file are copied to the bottom of the sheet.
3. Go to the Summary Page of the EIA 923 database and update formulas. This involves copying formulas to the right. As the EIA 923 file is so big, you should do this with the calculation set to manual. After you have copied the formulas, press the macro titled “FULL CALCULATE”
4. Create an intermediate summary page that is not as giagantic as the the EIA 923 database. Copy and paste special the yellow area in the summary page of the EIA 923 file to a new file. Find the databases for solar, wind and hydro. In the google drive, these files are in Chapter 5, under the Renewable section and then in the Resource Studies Folder. Copy and paste special as values the Summary page to each of the files.
5. Find the databases for solar, wind and hydro. In the google drive, these files are in Chapter 5, under the Renewable section and then in the Resource Studies Folder. Copy and paste special as values the Summary page to each of the files after using the filter tool to select the appropriate prime-mover. After tyou have created the file you can sort the file by the number of months for which data is available.
Variation in Wind Data
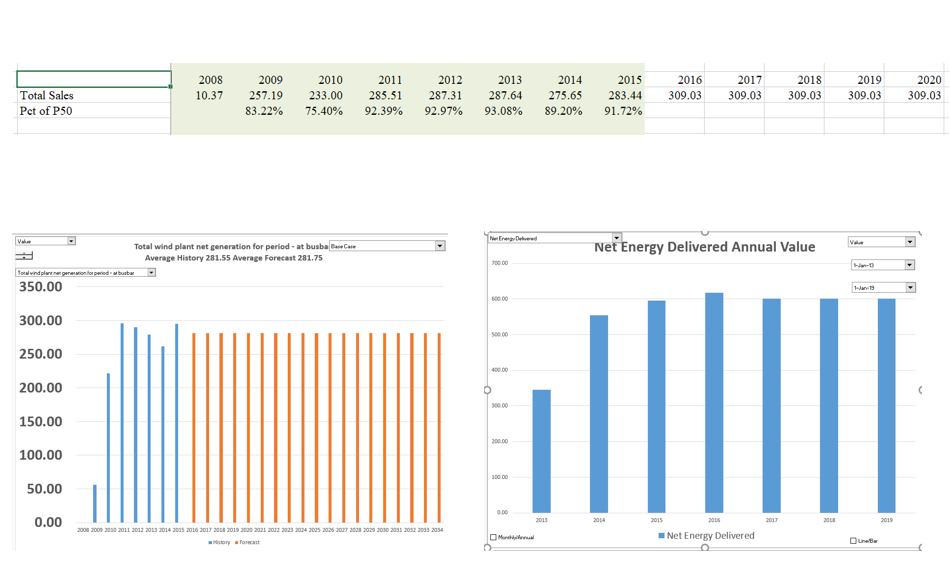
Before presenting wind variation from the database, I present a couple of examples of how the production in an actual wind farm varied as compared to original projected data. The table below shows data for a large wind farm in the state of Montana in the U.S. The total MWH sales are shown and then below the actual data, the percent of the original P50 is shown. In the first couple of years the errors were very large demonstrating start-up problems and bird problems. Later, the production has stabilized at somewhere between 89% and 93% of the P50 estimate. This demonstrates that there was a modelling problem with the consultant wind forecast. But once the permanent error is accounted for, the year to year variation is pretty minor.
Generation Database – Wind.xlsm
Uncertainty Analysis from Variation in Actual Solar Projects
I have created a database that contains actual historic production data on operating solar projects. In the U.S. the EIA collects data on every power plant production by month (some plants do not seem to report as well as others).
Subsequent lesson sets involve creating an analysing financial models. One deals with making a single project and another on making a portfolio of projects in a rooftop analysis.
Generation Database – Solar.xlsm
P99 etc Analysis.xlsx
Combined Analysis.xlsx
US Hourly Time Series Comparison.xlsm