As the cost of equity cannot be directly observed, different methods have been created to implicitly derive and estimate the cost of equity. But all of the methods require estimation of variables that are subjective. These subjective variables include the market risk premium; the beta; the expected growth rate; the expected return, and the expected market risk premium. This difficulty in measuring the cost of capital should be a backdrop for all of the seemingly sophisticated economic equations that are used for variables like beta, country risk premia, expected growth rates and other items.
Given the difficulty in measuring the cost of capital, I begin with a definition of the cost of capital, which is not as simple as one may think. The cost of capital is not simply the rate of return that is desired by an investor. Rather, it is the minimum return that is acceptable for to compensate for taking risk. The key word here is minimum. It is not the expected return; it is not the return that other people get on investments. For example, when an investor complains that the rate of return is too low to invest in a hydro plant, the investor is correctly interpreting the meaning of the cost of equity. But if the investor would continue build the hydro plant even if the return was lower, this return for which the investor would not walk away is not equal to the cost of capital as defined by the minimum acceptable return.
You can think of the cost of capital in a bidding context. In a highly competitive bid for a project that does not have some kind of provisions that give one company an advantage over another company (e.g., a solar plant bid in Dubai). You want to win a bid and offer a low price. Your manager wants a pretty high return. If you are to have any chance of winning the bid, you negotiate with you manager to push down the acceptable return to win the bid until you arrive at the minimum acceptable return. This minimum return must compensate for the risk you take if you win the bid. You can imagine how difficult it is to come up with a true number.
The most basic problem with estimation of the cost of capital is that nobody can observe the number. There are no contracts between investors and a company that write down the percentage cost of equity number such as 12.5% for the cost of equity capital; you cannot track cost of capital changes in the same way that you can see changes in stock prices, interest rates, gold prices, exchange rates and other things. These days you can easily find data for things like earnings per share, operating income, cash flow, price to earnings ratios and so forth for companies on the internet; but you cannot find a number for the cost of equity anywhere. Furthermore, measuring the cost of equity is different from measuring the cost of debt. Components of the cost of debt are written in loan contracts where parts of the interest rate such as the base interest rate and the credit spread are explicitly written down in loan agreements. These credit spreads are collected in databases.
Another general source of cost of capital/return on equity estimates is data presented by Bloomberg when developing reports on the levelised cost of electricity for different technologies. The table below presents comparative data for 2019 when the Bloomberg used feed-in tariff with data from a Bloomberg report presented for the first half of 2021. I have presented available data that does not include the same countries in different periods.[1] Data in the table is supposed to reflect project costs and investment in USD, but there is some confusion with respect to currency adjustments. For example, when discussing returns in China, the Bloomberg report states that “we estimate that some projects can go ahead with a 6.5% nominal equity return.” It is not clear whether this is a local return in Yuan or a return that is in USD. In Table 4 there is also some question as to whether the numbers represent the cost of equity which is the minimum acceptable return or alternatively whether the data is the hoped-for return. I believe low values for return on equity in the table (for example, Solar Low 2021) are the best representations of the cost of capital defined as the minimum return that is acceptable for the given level of risk. The return on equity data for Germany and Japan are notable and demonstrate that the international cost of capital for wind projects in 2021 can fall below 5%.
Table 4 – Bloomberg Cost of Equity
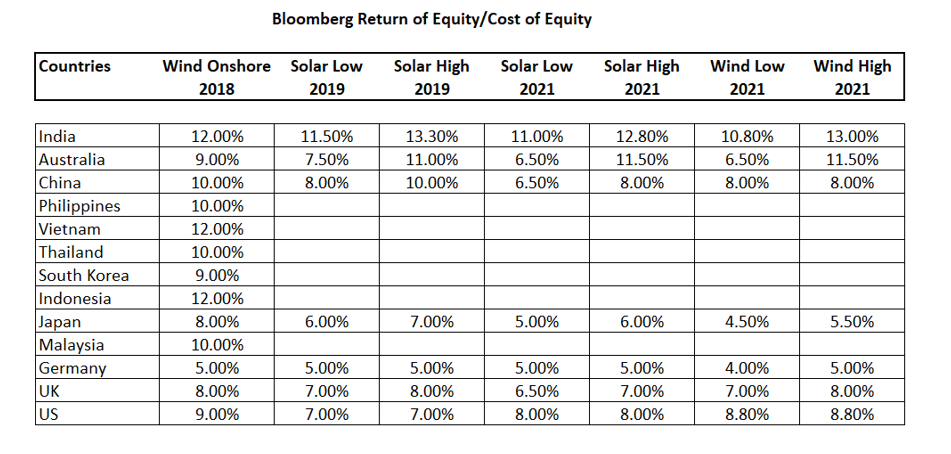
[1] The table is made from three reports published by Bloomberg New Energy. The latest report was published in June 2021. I have included references to the reports in the LCOE section of www.edbodmer.com.
The NEPRA concept paper noted that: “Capital Asset Pricing Model (CAPM). CAPM was first developed by William Sharpe and John Lintner for which William Sharpe was given the Nobel Prize in 1990”. There are now big questions surrounding the CAPM both in terms of whether the model is even theoretically valid in measuring the cost of capital and in terms of the appropriate inputs to the model. But the CAPM is the most used model in computing the cost of capital. For example, a recent academic article stated: “The Capital Asset Pricing Model (CAPM) is the predominant model of risk and return taught by academics in universities and business schools in undergraduate, MBA, and executive education programs. The CAPM is also widely used in practice, in particular, to estimate the cost of (equity) capital for a firm. However, it is well known that the CAPM does not fit the data.” While some academics suggest that the cost of capital can be estimated with more esoteric methods using the Arbitrage Pricing Model, the real alternative to the CAPM is deriving the cost of capital from valuations and estimates of cash flow. These alternative methods are discussed in Section 5. Given uncertainties associated with CAPM inputs it is frustrating to read academic studies that attempt to test the CAPM when the real problem is that the inputs are so difficult to measure.
A simple representation of the CAPM model is the following formula below. This formula is intuitive as you begin with a risk-free rate and add a risk premium as you would add a risk premium for a bond.
Cost of Equity = Risk Free Rate + Beta x Equity Market Risk Premium + Country Risk
Risk Free Rate
I note that this overstates the risk-free rate because long-term bond yields include inflation risk. This is because when and investor buys a 10-year bond, the return is in fact not at all risk free in real terms even if the investor holds the bond to maturity. If the inflation rate turns out to be higher than the rate implied when the bond is purchased, the investor loses real purchasing power.
Estimates of the market risk premium can vary by a wide margin and some analysts have used estimates have been more than 7% in the past. If you go back to the fundamental definition of the cost of capital, the risk premium is minimum return that investors will accept relative to the risk-free rate. One can argue that this is a psychological/philosophical number that reflects investors minimum requirements can only really be determined by asking investors about their minimum expected returns. In Section 4, I suggest that estimates of the general EMRP of more than 5-6% cannot be theoretically reasonable in the context of an economy that grows at 2-3% on a real basis because returns are growth rates. But if market participants have irrational requirements for the EMRP numbers, one could accept a higher number than the 2-3%. As such, I have accepted the high end of estimates made by surveys and that a separate EMRP is not necessary for Pakistan. I emphasise that the EMRP estimated from the value of a stock index less the risk-free interest rate is completely distorted by capital gains caused by the change in the cost of capital itself. For example, if the value of stocks increases by 10% because of a decline in the cost of capital, this change in the value does not reflect earned returns of companies and should not be included in the risk premium.
Trends in Cost of Capital from Credit Spreads
One more way to evaluate general trends in the cost of capital is to evaluate the cost of capital for risky bonds. The general category of risks for bonds is driven by the ratings from S&P, Moody’s or Duff and Phelps. The lower the bond rating (a bond rating of B is lower than BB and is lower than BBB) the higher the cost of capital for the bond. Figure 13 illustrates the credit spreads trends for BB and B bonds.[1] The graph in Figure 13 shows that credit spreads have declined over the last decade. This decline in credit spreads implies the cost of capital has decreased for risky investments and is now 4.84% for B bonds which have the same rating as sovereign Pakistani bonds. I note the bonds which theoretically have the same risk of default require a lower credit spread relative to previous years. (The spike in the graph occurred at the beginning of the pandemic). If credit spreads have declined, it is reasonable to assume that the cost of equity has also declined. I note the credit spreads are similar to the credit spreads used by Damodaran in computing the country risk premium for countries that have rated bonds. For Pakistan, the bond rating is B- suggesting that the risk premium would be 4.84% or higher. Note, that the source of the data from Merrill Lynch does not specify the tenor of the debt and that longer bond tenors have a higher risk premium.
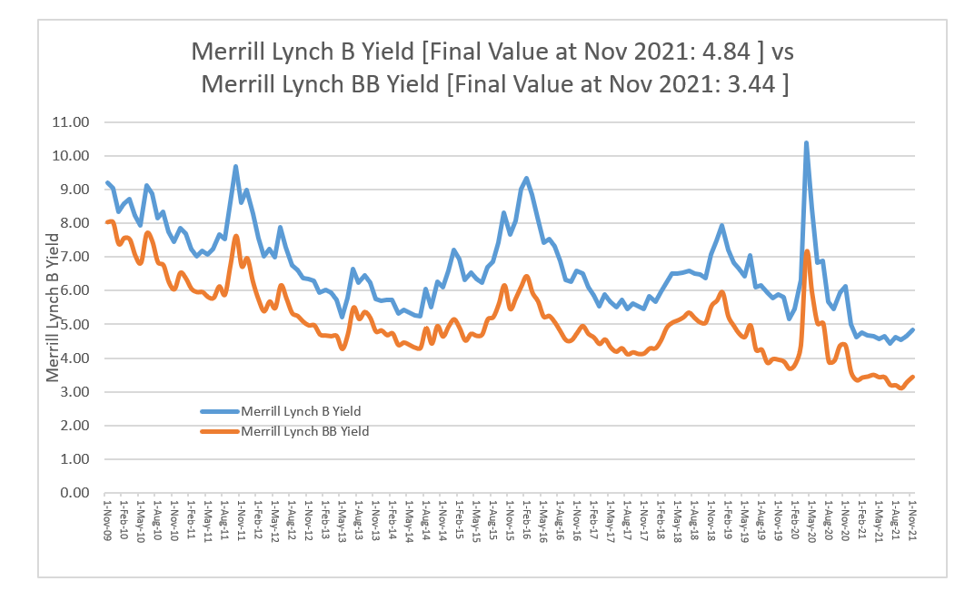
[1] The yields on risky bonds are provided by Merrill Lynch and published by FRED. The spreadsheet is available on the website.
Equity Market Risk Premium
In applying the equity market risk premium or EMRP in the CAPM estimates, I first note how difficult it is to get your head around what this mysterious number is. If you could somehow pretend there was some kind of marginal investor who is the person or institution who is buying or selling shares, the equity market risk premium would be the minimum extra expected return that theoretical investor would need to take his money out of risk-free investments and invest in a portfolio of shares. Just writing these words can make your head spin. Historically the volatility of US stocks has been about 20%, while long-term bonds have a volatility of 7.6% and short-term bonds have a volatility of 3%. In my opinion, the equity market risk premium is somewhere between a psychological concept and a philosophical idea. But note a couple of things. First, the EMRP is about future returns and not about past experience, it is about expectations. I have written that the EMRP is affected by changes in the cost of capital itself and that returns earned from making an investment should not be distorted by changes in the cost of capital itself. Second, as the EMRP reflects the returns or rates of growth to a group people in the economy, if the returns and the EMRP is greater than the real growth in the economy, then investors as a group will always get richer at the expense of everybody else. I leave it to the reader to contemplate whether this is sustainable in the long-run. Third, any discussion about using geometric versus average returns should have been resolved ages ago. Returns are measured on a compound basis. Fourth, the portfolio of stocks that evaluate the return on stocks relative to risk free bonds should not be limited to a particular geographic location. For example, there is no reason to expect an investor in Pakistan who can invest in stocks all around the world to have a different minimum required criteria for taking equity risk versus bond risk than any other investor in the world. Both investors can invest in the same portfolio.
When thinking about the risk premium without getting trapped by technical discussions of items such as the geometric mean versus the arithmetic mean you can think of some very basic economic analysis of the supply and demand for capital supplied by people who what to invest in the market rather than in risk free securities that are earning almost nothing. You can think of pension funds or insurance companies for example. As the supply of capital increases and the alternatives of investing in bonds produce low returns, the mysterious risk premium which is the minimum acceptable return will decrease. This indeed is just about the only way to explain increases in market indices.
A few things that should be considered in evaluating the EMRP include:
- If the EMRP is higher than the real (not the nominal) growth rate in the economy, investors as a group will continue to get richer while the rest of the economy will become poorer. This means that assuming an EMRP much higher than the real growth in the economy is a very questionable idea.
- As money grows in a non-linear manner with increasing returns, the amount of money that you generate from the risk premium produces a dramatic number relative to the risk-free rate.
- If there were no changes in the cost of capital and investor supply and demand for risk did not change — two completely unrealistic assumptions — then the historic difference between the market portfolio and the risk-free rate could represent an equilibrium payment for risk. If the return was lower on stocks, then investors would move out of stocks and the return would increase. The problem is that the cost of capital changes as well as the supply and demand for risk capital.
- Changes in the cost of capital produce capital gains or losses that are measured in the market index but do not have anything to do with the earning power of a company. For decades, declines in the cost of capital have led to increases in market indices.
- In comparing the EMRP with credit spreads on risky bonds, it is not appropriate to assert that bonds have lower risk than equity. Bonds with a rating such as B or BB have downside risk but no upside potential other than the credit spread. Stocks have expected returns with both upside potential and downside risk with an expected return equal to the EMRP. The EMRP compensates for upside and downside volatility while the credit spread deals with only with downside risk.
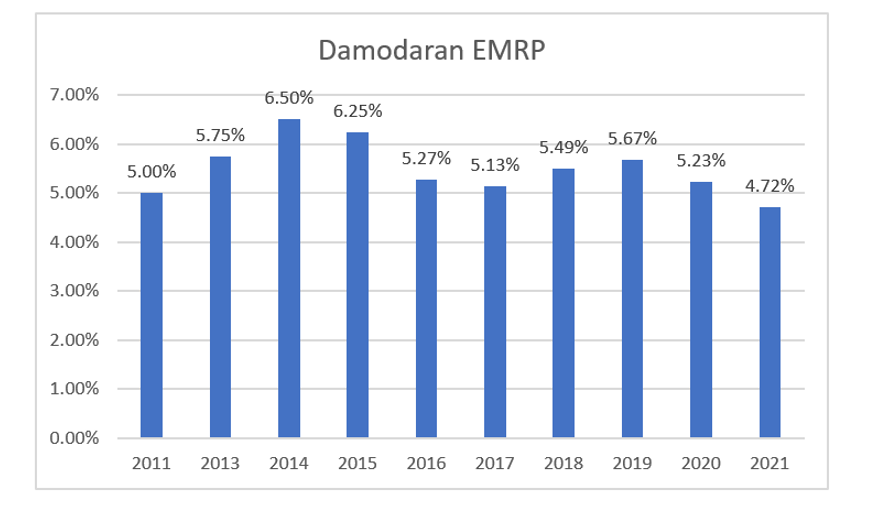
If somebody wants to criticize the CAPM, they could point to the uncertainty and variation in measurements of the EMRP. The following quote illustrates the problem: “While users of risk and return models may have developed a consensus that historical premium is, in fact, the best estimate of the risk premium looking forward, there are surprisingly large differences in the actual premiums we observe being used in practice. For instance, the risk premium estimated in the U.S. markets by different investment banks, consultants and corporations range from 4% at the lower end to 12% at the upper end.” With this kind of range in the equity market premium, the CAPM becomes useless. The range in the EMRP is the primary argument for deriving the implicit cost of capital from cash flow forecasts.
Figure 16 – Equity Market Risk Premium Estimated by Damodaran
EMRP Surveys for Use in EMRP Estimates
As I have already stated, the cost of capital that we are looking for is the hurdle rate of investors before they will refuse to invest. This idea applies to the EMRP as well as other cost of capital measures. For example, if a 5% EMRP is not rational because of some of the factors I noted above, but investors use this EMRP in making investments, it is the cost of capital defined as the minimum required return before an investment is made. In this regard, there have been efforts to survey people market participants in terms of the EMRP. The table below illustrates surveys from a relatively recent study.[1]
Table 6 – Estimated EMRP from Surveys
[1] Fernandez, P., J. Aguirreamalloa and L. Corres, 2011, Equity Premium used in 2011 for the USA by Analysts, Companies and Professors: A Survey, Working Paper,