This page addresses a subject that I get very emotional about — the evil magic potion of suggesting that enormous political risk premiums to the cost of capital for developing countries. The dramatic and unjustified transfer of wealth created by these cost of capital premiums is promoted by Professor Damodaran of NYU. He and his followers do not seem to understand the dramatic effects of very small differences in cost of capital over long periods and the social and political ramifications of what would happen if these premiums were actually realised. Damarodan promotes this theft because he applies nonsensical and seemingly sophisticated formulas that have no founding in reality. To illustrate what I am talking about I have included a few files, videos and the associated explanations on this page. If get the cost of capital files from the google drive, you can find files referred to on this page if they are not provided separately.
In estimating the cost of capital for Pakistan it is traditional to add a country risk premium to the CAPM estimate. Country risk premium theory comes from the notion added risk arises from government actions that will lead to declines in cash flow that are not part of expected cash flow. In other words, when the discount rate is applied in valuation, there is generally not an explicit recognition of the probability of country default. The country risk premium is and should be a controversial item in valuation and cost of capital because it has dramatic effects on PPA prices, particularly for capital intensive technologies like solar and hydro. To illustrate the controversy of adding country risk premiums to the cost of capital, take the example of selling toothpaste in Pakistan and in the U.S. The country risk premium would suggest that the cost of capital for a little shop selling toothpaste in Pakistan would have to sell toothpaste for a higher price than a similar company selling toothpaste in the U.S. simply because the shop is operating in Pakistan rather than in the U.S. This is because the capital deployed for inventory, selling equipment, buildings and other equipment associated with selling toothpaste supposedly has much higher risk in Pakistan than in the U.S. While I disagree with the whole concept of country risk premium for many industries such as this example of toothpaste, my opinion is not a conventional point of view when computing cost of capital. In this section I present evidence on the country risk premium that is largely derived from the interest rates on Pakistani bonds where the repayment is in USD.
To address the country risk premiums, consider the following issues an include selected case studies:
- Where does country risk come from
- How much compensation to investors is there in country risk premiums
- What are the implied default risks of government contracts in country risk premiums
- What is a better way to measure country risk premiums
- Circular problems with high prices driven by country risk premiums
I have explained my theories about the country risk premium in many videos and files. My most recent file and video is shown below. I discuss how the analysis of country risk premium should involve defaults on contracts and I complain a lot about applying arbitrary risk premiums to different industries and to things like maintenance contracts and EPC contracts.

I will explain my thoughts with a case study of Pakistan. Lets start with the estimated risk premium in the Damadoran data that people get from the internet. The graph below shows the country risk premium for different companies and illustrates that the risk premium for Pakistan is estimated to be 9.54%.

Theory of IRR, Macro Economics and Wealth Transfer
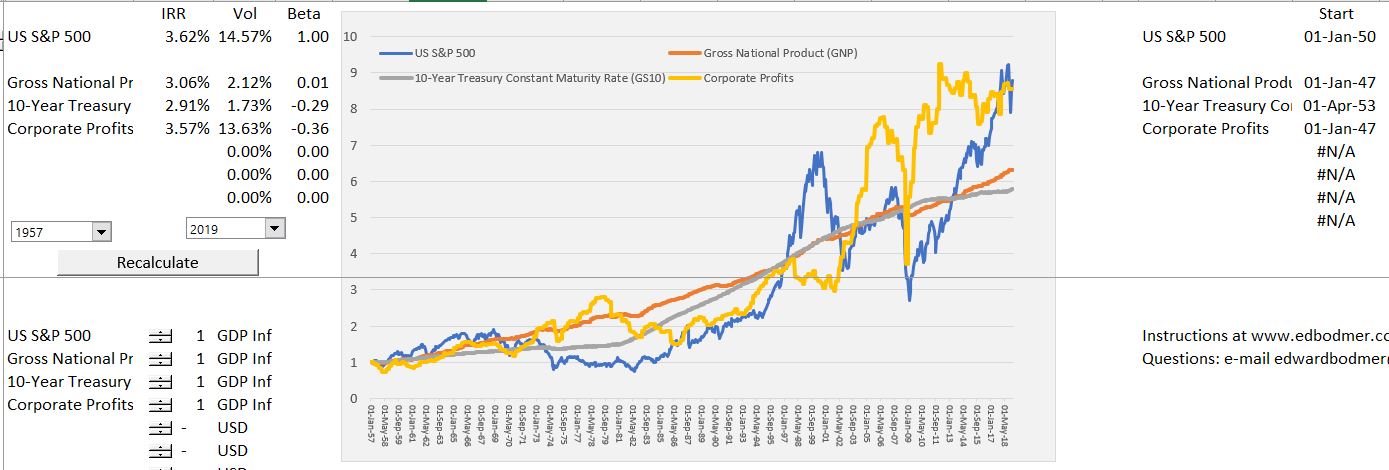
To demonstrate some general ideas about IRR’s and risk transfer, I use the comprehensive stock price and economic activity database (you can find more information about how to use this at associated link). The graph below illustrates stock returns, economic growth, and bond returns for a long-term period (since 1957) for a country with a lot of political risk — the U.S. (I am not joking about this). The IRR next to the graph can be called the TSR and measures the compound growth for the various series (that is what the IRR measures and it is in inflation adjusted terms). Think about a couple of issues with respect to this workbook and the screenshot below. First, notice the small difference in the inflation adjusted returns makes a very big difference in the final amount of money an investor gets. When you make your valuations or think about things like country risk premiums or small company adjustments to WACC or cost of capital, that is why seemingly small differences make a big difference in value (see the link). Note also that the returns above inflation are not very high. This means that expecting to earn high returns on stocks can be very silly. Further, you should not be surprised that small differences in country WACC make a big difference in value. You can also think about volatility and how much the volatility has changed over time. Think about how you need a premium for the volatility. But if you need a volatility and corporate profits are a higher percent of GDP, something has to give.
Stock Prices of Individual Companies, Value and Risk
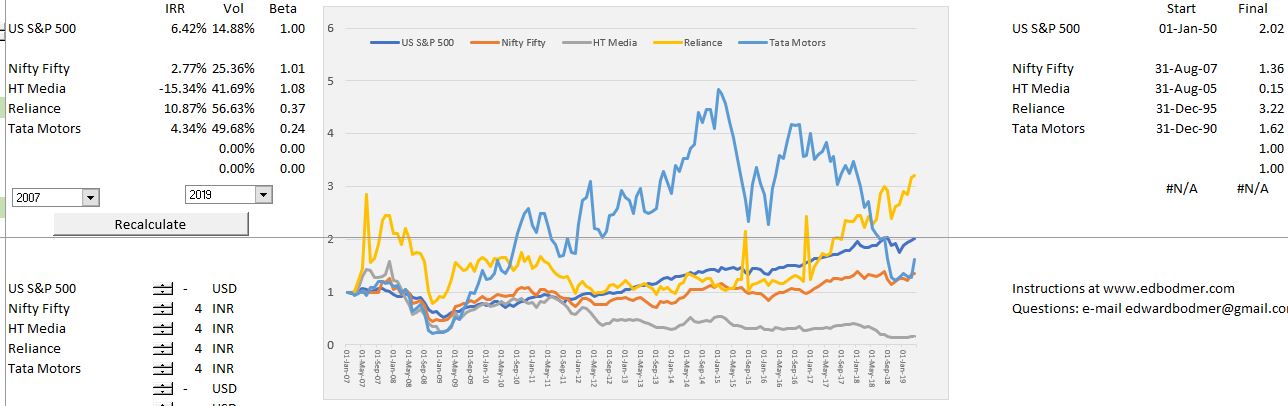
Now you can look at a couple of stocks I used some stocks from India and compared them to European or U.S. stocks. To do this you need to make sure the currency is consistent — yahoo reports stocks in different currencies and indices are generally expressed in the local currency. This means that to make a reasonable comparison some of the series must often be adjusted. To evaluate corporate value, I have a picked a few stocks from India — HT Media, Tatar Motors and Reliance.In the long-run the stock values are driven by earnings and cash flow. They are of course affected by expected future cash flow and risk. The screenshot shows that HT Media had a decline in stock price; Tata motors had an increase and then a decrease in price; and Reliance had an increase in price. The right hand side of the screenshot shows the accumulated returns from investing in different stocks over the period. These numbers are converted to USD so you can compare the returns in common currencies. Notice that if you invested in the US stock market, you would have doubled your money over the period. If you invested in the Indian stock market, you would receive 1.36 on every dollar you invested. For Reliance you would have go 3.22 — this is the implication of an IRR 10.87%.
[wonderplugin_video iframe=”https://www.youtube.com/watch?v=T_SxwJJYPBM&t=15s” videowidth=600 videoheight=400 keepaspectratio=1 videocss=”position:relative;display:block;background-color:#000;overflow:hidden;max-width:100%;margin:0 auto;” playbutton=”http://edbodmer.com/wp-content/plugins/wonderplugin-video-embed/engine/playvideo-64-64-0.png”]
[wonderplugin_video iframe=”https://www.youtube.com/watch?v=KFzceICWujI&t=9s” videowidth=600 videoheight=400 keepaspectratio=1 videocss=”position:relative;display:block;background-color:#000;overflow:hidden;max-width:100%;margin:0 auto;” playbutton=”http://edbodmer.com/wp-content/plugins/wonderplugin-video-embed/engine/playvideo-64-64-0.png”]
[wonderplugin_video iframe=”https://www.youtube.com/watch?v=VnbW0wbIy4I&t=4s” videowidth=600 videoheight=400 keepaspectratio=1 videocss=”position:relative;display:block;background-color:#000;overflow:hidden;max-width:100%;margin:0 auto;” playbutton=”http://edbodmer.com/wp-content/plugins/wonderplugin-video-embed/engine/playvideo-64-64-0.png”]
What are Risks for Different Countries — Is Drinking Beer in Riskier in Nigeria than in England
Ultimately risks come from volatility in demand