Introduction
On this page I demonstrate creating a financial model to evaluate the economics of data centers (measured with total cost of ownership or IRR). The financial model ultimately evaluates the cost of data centers and in particular, the cost of tokens from data centers different characteristics (e.g. ranging from legacy data centers to data centers that use the latest NVIDA chips). Given a set of assumptions the model uses the concept of Total Cost of Ownership (TCO) to evaluate the effect of different technologies and innovations. Developement of the model forces you to evaluate parameters like the capacity in terms of millions of tokens per kW per month, the load factor of a data center which could be affected by surplus capacity, the capacity factor for electricity cooling needs, the capital cost of a data center which is measured in kW of IT use, the efficiency of electricity cooling with is evaluated with the PUE ratio and other factors.
I begin the modelling on this page by discussing another model that was designed to compute the total cost of ownership of a data center which provides a good case study in what not to do with financial models. The models you can download on this page uses data from AI for inputs combined with essential financial modelling principles. I used the example of data centers as the basis a financial modelling course that walks through how to create inputs using the InputC technique and then beginning a financial model based on time lines and the operating characteristics of a data center. The operating characteristics comming from the InputC include the IT capacity measured in kW, the efficiency of electric usage using the PUE, the amount of kW that can be converted to a measure of the output like millions of tokens or GPU and the load factor of a data center that measures the amount of potential output that is actually sold. These operating characteristics are established in the financial model. Next the modelling techniques convert the cost charactreistics including the capital cost, the lifetime of IT equipment, the cost of electricity and general operating costs into a measure of either the IRR or the total cost of ownership. Macros with goal seek and a couple of other techniques are used to convert the financial model to a the cost of ownership (by setting a target IRR).
.
.
Data Center Economics
I am in no way an expert in data centers nor do I have any business whatsoever discussing things like whether there is an AI bubble and the spending of hyperscalars. But I argue that through forcing yourself to make a model of single investments in terms of return and risk, you can evaluate economic issues that can at least frame issues. With the model you can test the required prices uses different assumptions and evaluate what prices are necessary to allow continued building of capacity. When thinking about any investment that is subject to general market forces, you can boil questions down to demand including elasticity and surplus capacity. In terms of supply, you can think about issues of cost structure and technology changes causing obsolesence. Other issues include the macro questions involving the long-term cost of energy.
The model attached to button titled part 5 below is not a model tied to financing of data centers where leases and transaction structure can remove data center risks from the special purpose vehicle and transfer risks to the The manner in which these issues are addressed in a financial model of a single asset include:
- A fundamental issue is what is the level of cost per million relative to the current pricing. If the total cost of ownership is above the current price because of promoting usage (addiction), the price must increase to provide profits. If the price must increase, the question of demand elasticity comes next. With significant price elasticty, the price increase causes demand to decline.
- The question of surplus capacity in data centers can be evaluated on a single investment basis using the utilization factor. For data centers it can be confusing to distinguish between load factor which is the percent of maximum electricity supply necessary to cool the data centers and the utilization factor which is the percent of total capacity over time that is sold. The utilization factor can be measured on the basis of millions of tokens of GPU. If there is surplus capacity, the utilzation factor will decline, resulting in lower IRR. As with other issues the decline in IRR can be translated into higher total cost of ownership.
- The cost structure of a data center depends as with other investments the capital expenditure per unit and the operating cost. The operating cost depends on the efficiency with which the amount of electricty for cooling the IT equipment compares the amount of electricity required to run the equipment. Unfortunately, both the amount of electricity for the IT equipment and the amount of electricity is measured in kW. To measure efficency using the PUE which measures the amount of electricity input relative to the amount of electricy used for IT, I use kW with additional subscripts — kWit and kWt — for the kW directly used for IT and the kW purchased in total.
- The operating cost of a data center depends in large part on the cost of electricity. Typical forecasts assume an incease along with the general inflation rate. But reviewing long-term gas prices, options to use battery storage and evaluation of the possiblity of shale gas to diminish can have a large effect on cost.
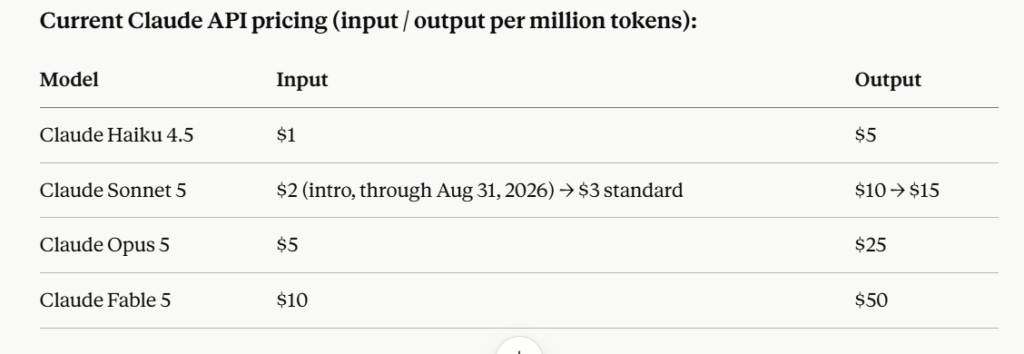
- The ultimate pricing received by data centers is confusing. Legacy data centers were rented outed something like a building rents out space per meter squared. A third method is to compute the total ownership cost using the GPU, for which you need to know the GPU per kW of IT equipment. The data centers did not vary with how much users actually consume variables such as the number of tokens. So, we can compute the amount of possible tokens that can be produced in terms of million tokens per kW of IT equipment. This technique allows you to compare the NVIDIA data centers with other data centers using technology that produces less tokens. The pricing of tokens becomes more complicated to assess because the pricing of tokens is different for different kind of uses as illustrated below.
.
.
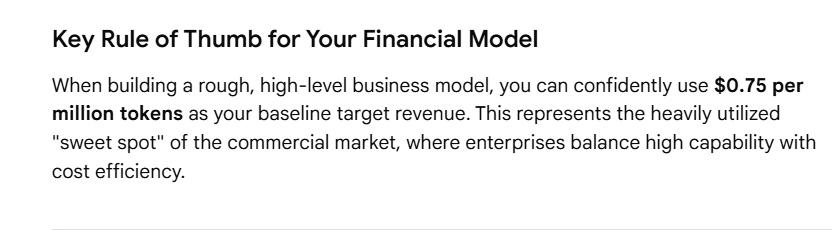
After trying a few times to get a representative answer, Gemini suggested low price of .75 per token below. The TCO analysis evaluates whether this price of tokens can produce an IRR.
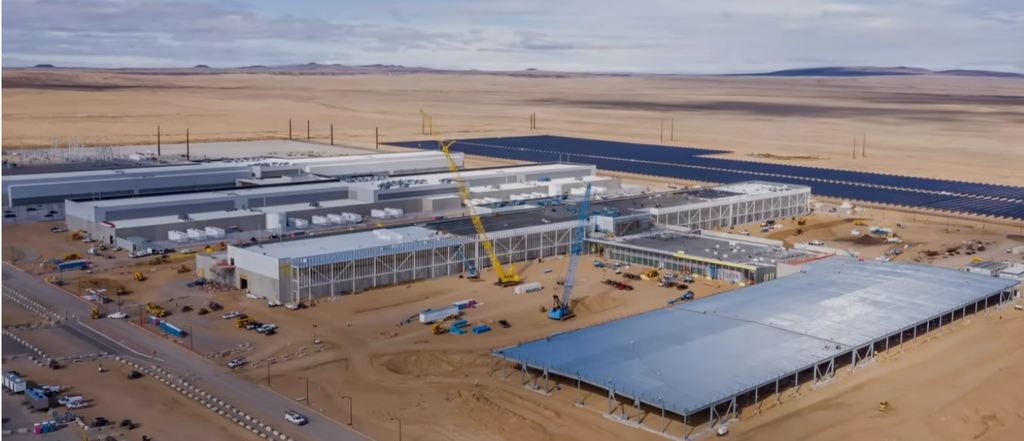
Along with thinking about issues associated with the fundamental economic parameters of a single data center, the exercise has made me think about issues like what are the impacts on overall GDP of a country that comes from the big expansion in data centers and the effectiveness in using AI when you are not sure about parameters in a financial model and you would like to make sensitvity analysis. The capital investment in data centers does increase the GDP whether the data centers result in over-capacity or not. Further, the increase in GDP has nothing to do with whether the AI resulting from the data centers produce an increase in productivity or not. For me this just illustrates distortions in the GDP in the way the expenditures on military spending increase GDP but may not improve the quality of life. After the data centers are build, the GDP is affected by the profit of the data centers, meaning that if there is surplus capacity of data centers, the GDP will be reduced.
.
.
The model is public and can be found on the open compute project (OCP). I began analysis of data centers by attempting to make the model a more reasonable tool where you can add different technologies and make a better analysis of total cost of operation. After attempting to work with the OCP model, I gave up on trying to modify the model and created a new model from scratch. The first model that I created was rather simple (part 4). The model attached to the fifth button below works through the IRR and the total cost of ownership in a more careful manner with drill down on cost of electricity components and a more detailed list of data centers. The final data center model also includes different ways to make scenario analysis. The models are all based on public data with the potential to adjust the data with specific configurations. I explain the process to arrive at the final model starting with the publically available model from the OCP.
Five different data center models are attached to buttons below. The first model has remarkable complex formulas and use of VLOOKUP and HLOOKUP along with matrix multiplication and use of INDIRECT with range names that limit the ability to move things around and add scenarios to the model. I don’t mean to be too negative with respect to other people’s models, but these modelling techniques make the model very difficult to use. The model did prompt analysis of different electricity equipment in a data center and the idea of computing total cost. In the second model I made changes to the OCP model and my intention was to make the more flexible, transparent and structured. The second model illustrates how you can fix and restructure a complex model like the public OCP model. In this model the different parts of a date center model are separated, the VLOOKUP and HLOOKUP are changed to XLOOKUP, the input configurations are changed, a financial model is added and the very detailed calculations with matrix algebra are put into a different sheet. In the end, I did not use this model because it was better to just start over with use of INPUTC and a more structured approach. The third model is a model I worked on that concentrated on
.
.
.
.
.
Model 5: Model with Full Operating Data and Scenarios to Compute Total Cost of Operation
.
Data Center Resources
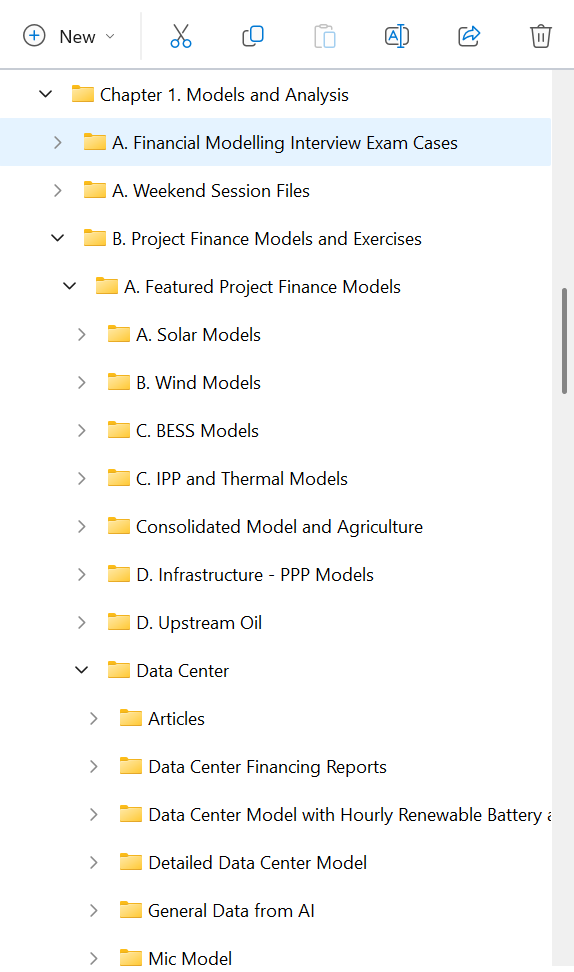
The following two screen shots show some of the data that I have complied about data centers. The first screenshot shows where you can find the data under Chapter 1 and then under the featured models.
.
.
The screenshot below shows how you can download the models from the google drive and other related data including financial reports.
.
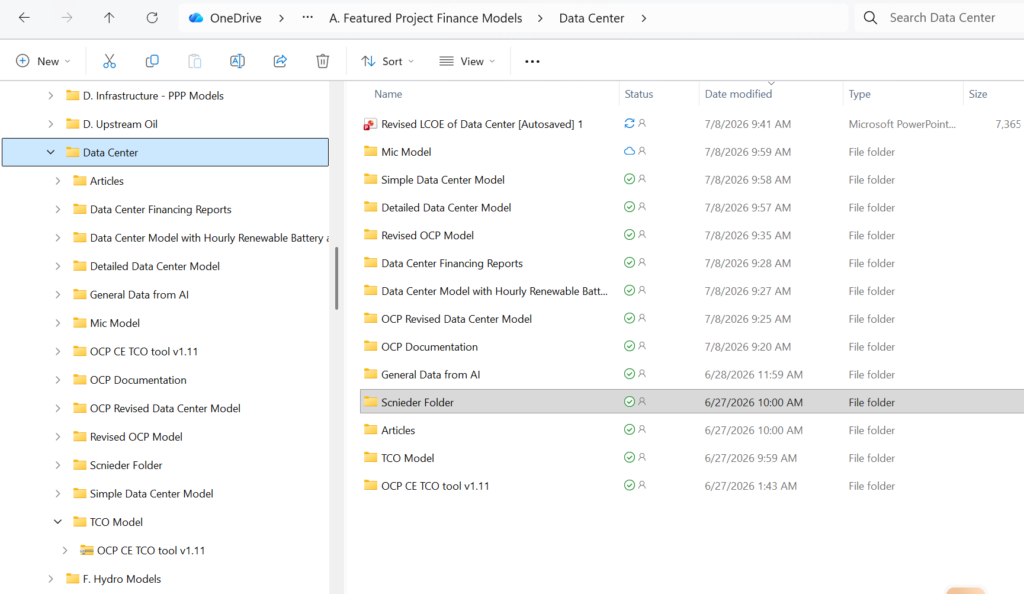
.
The remainder of this page describes four different models of different data centers.
Open Compute Project
The file below can be found on the open compute project (OCP). With respect, this model does not follow reasonable modelling practices. Some of the areas where I think the model is not very helpful in analysis of detailed electric configurations nor provide an overview of what kinds of data centers produce overall prices. The model has some clear financial errors. Depreciation is included in cash flow; electricity purchases are made on a continual basis for back-up generation; the total cost of ownership does not divide by electricity used by IT, thereby evaluating efficiency. There are good things about the model and by opening the model you can find some good stuff. You can also look at how the indirect function is used with range names and see how matrix multiplication can be used (again, with respect, I think these are bad modelling practices.) The screenshot below shows where you can go to find the open compute project model.
.
.

.
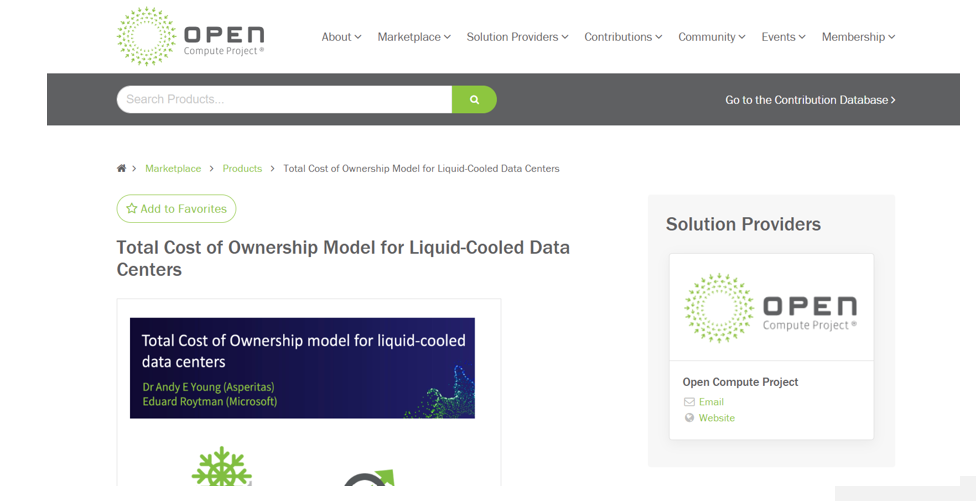
.
.
Ths screenshot below illustrates how the output from the model. The net present value of costs supposedly demonstrates the total electricity cost of the data center (not the total cost). It is not divided by a metric that represents how to evaluate the required price in terms of kW packets or in terms of tokens for the data center.
.
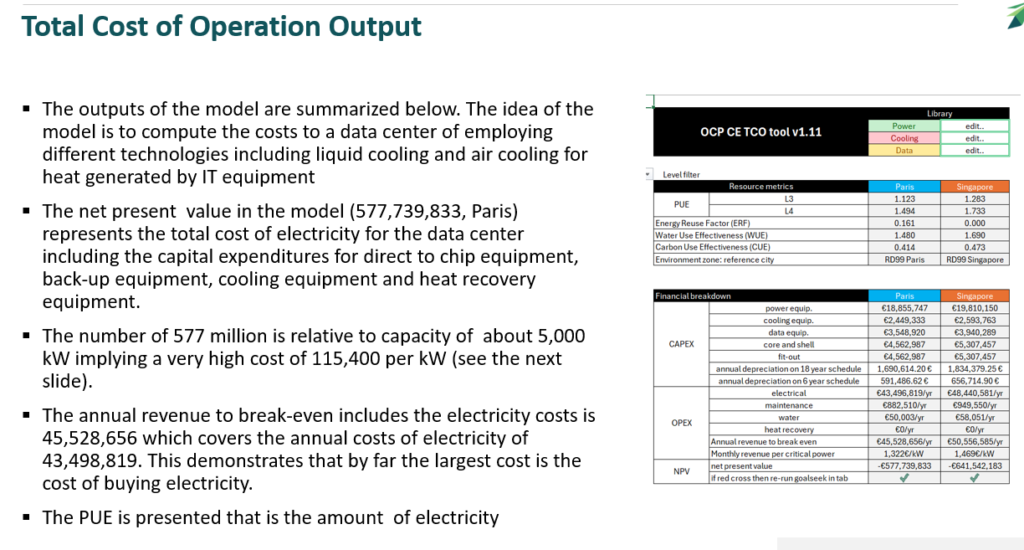
.
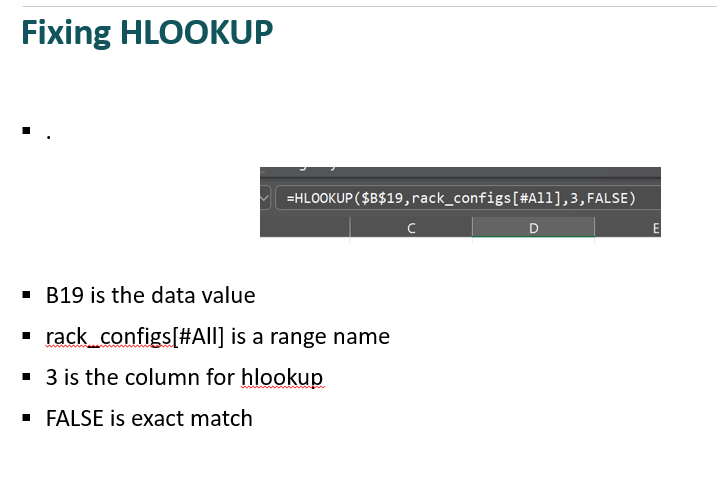
In the next screenshots I show some screenshots from the model with excel formulas that may look impressive but can make the model very unflexible, untransparent, and unstructured. First,look at the HLOOKUP function combined with the INDIRECT function. The J4 is the thing to lookup. The indirect tells the table to lookup in. The false means it must be an exact match.
.
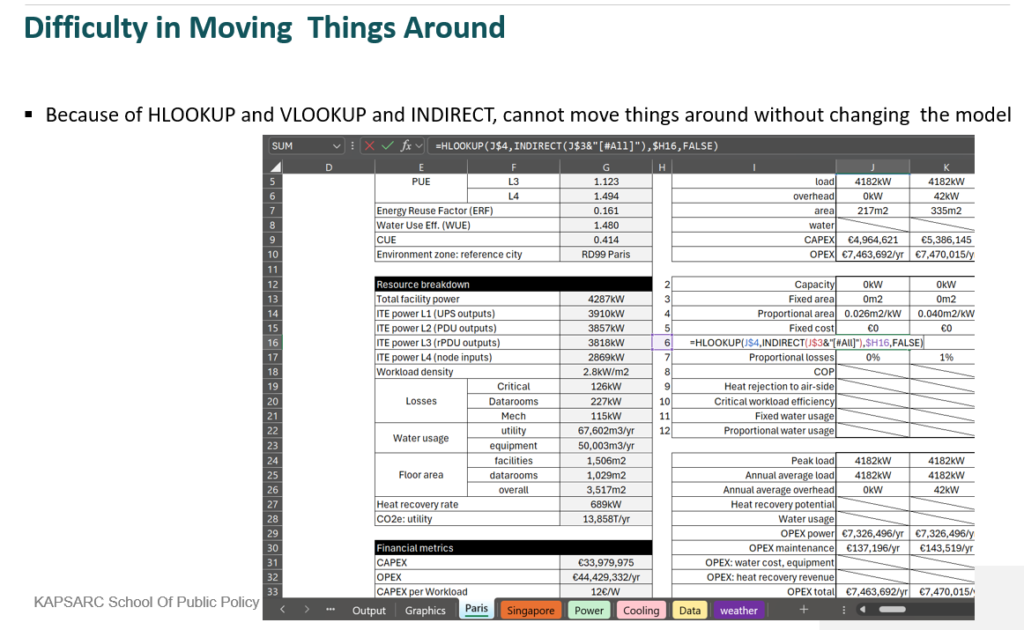
.
The model contains a lot of complex equations. If you want to dissect this equation and the equation would have to be separated into many different formulas.
.
.
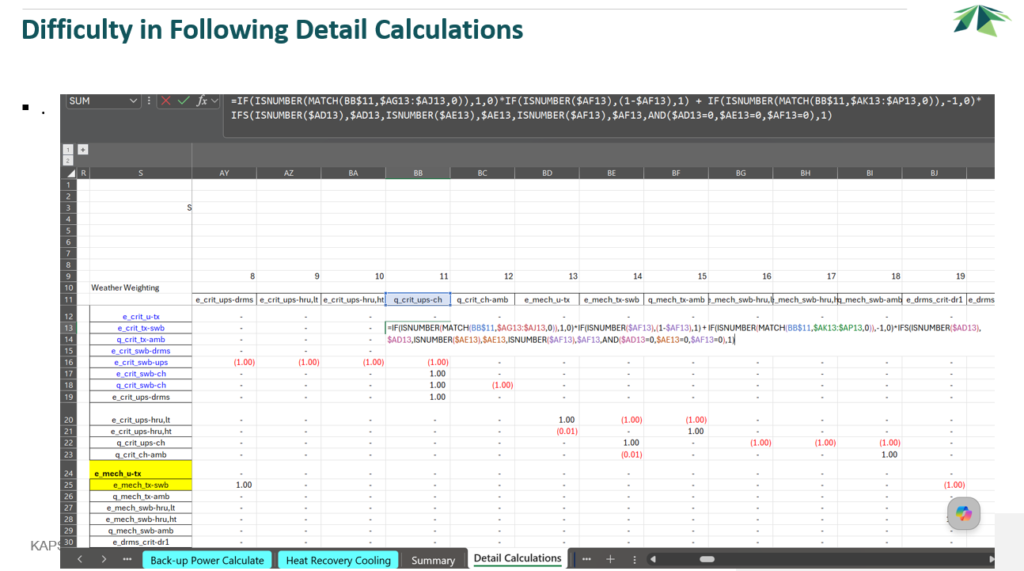
.
.
.
Revisions to OCP Model
Simplyfing inflexible equations and better structuring inputs and outputs.
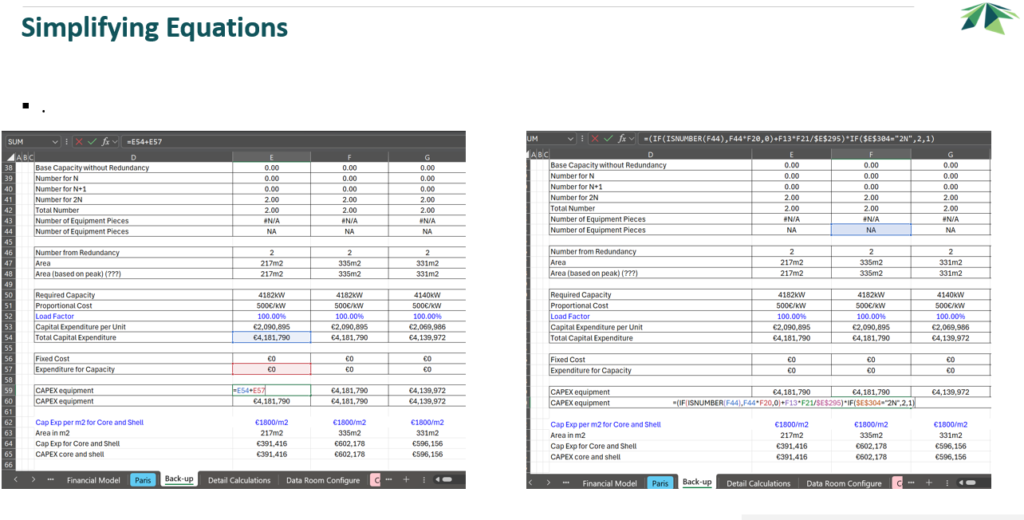
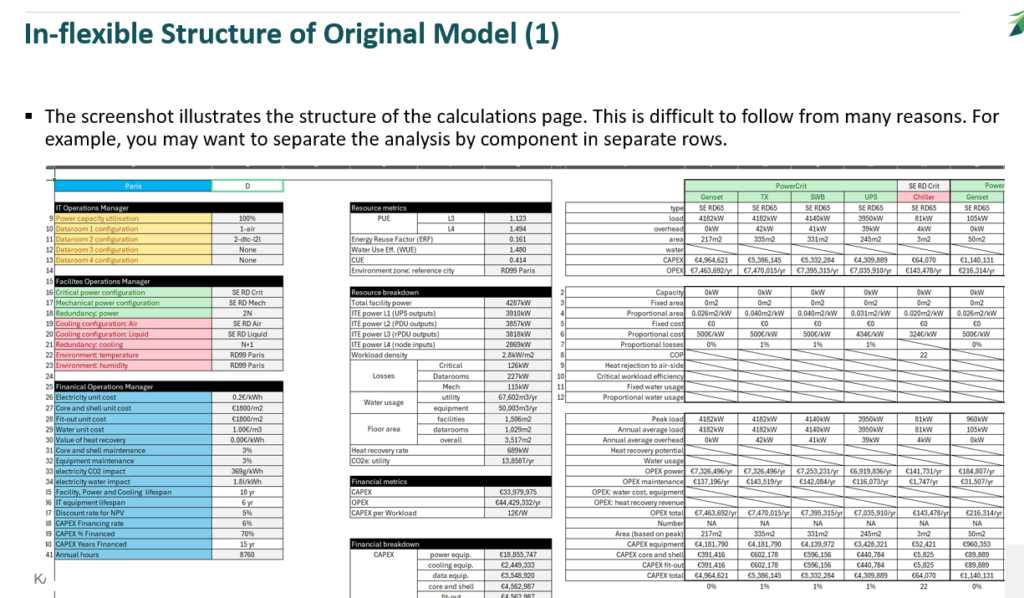
.After opening the OCP model and not really understanding data centers, I attempted to use the same inputs in the OCP model and simplify the equations. My idea was to begin with this model as it seemed to be detailed and developed by experts in the industry. To revise the model I first found the VLOOKUP and HLOOKUP functions that used the INDIRECT function so I could move things around. Then I re-arranged the inputs and outputs so the model was somewhat more transparent. My objective was to follow the general religion of FAST where the model would be flexible (you can easily add different data centers, change timing assumptions, make scenarios); the model would be accurate where an annual financial model could be used evaluate mistakes; the model would be structured where the model would show the electricity purchased, the amount of IT capacity, the amount of tokens and other issues; and the model would be transparent where you could follow the calculations, make adjustments and enhance the model. The model did not meet these fundamental requirements and demonstrates that the general ideas of FAST are pretty good. My revision to the OCP model that I did not complete is attached to the button below.
.
.
.
.
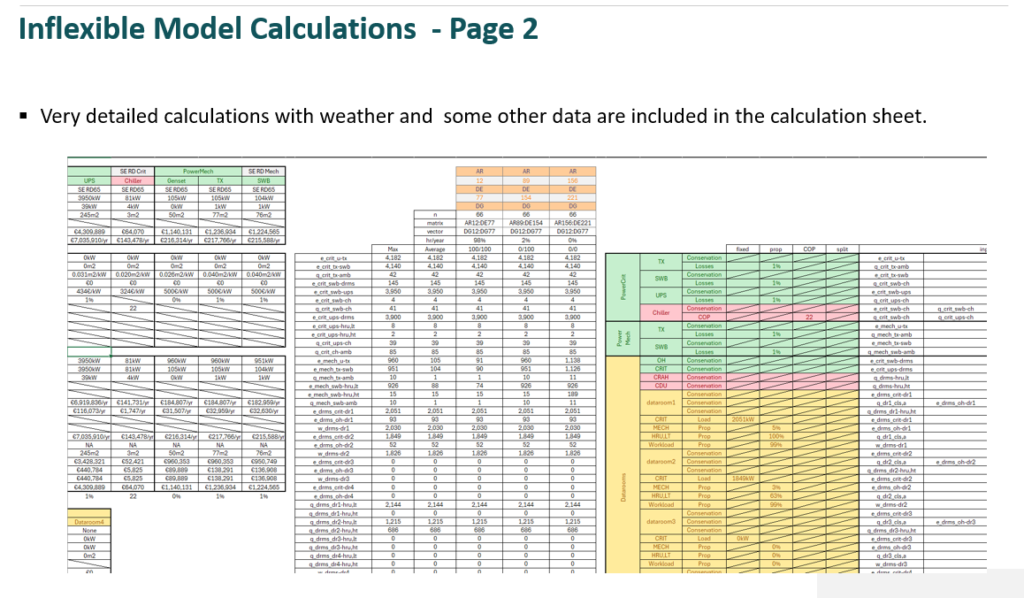
The calcualtion part of the model was unstructured where it was difficult to follow where the calculations were started and then move to electricity requirements.
.
.
.
Electricity Costs in Data Center
In beginning to think about data centers, I studied the electricity costs of a hypothetical data center in Germany. This data center was to use renewable wind energy with a very high hub height along with batteries and purchases from merchant markets markets. The analysis requires understanding the PUE ratio for efficiency relative the the kW size of the data center and load factor which is not necessarily 100%. The analysis is illustrated in screenshots below and follows other models that apply hour by hour analysis.
.
.
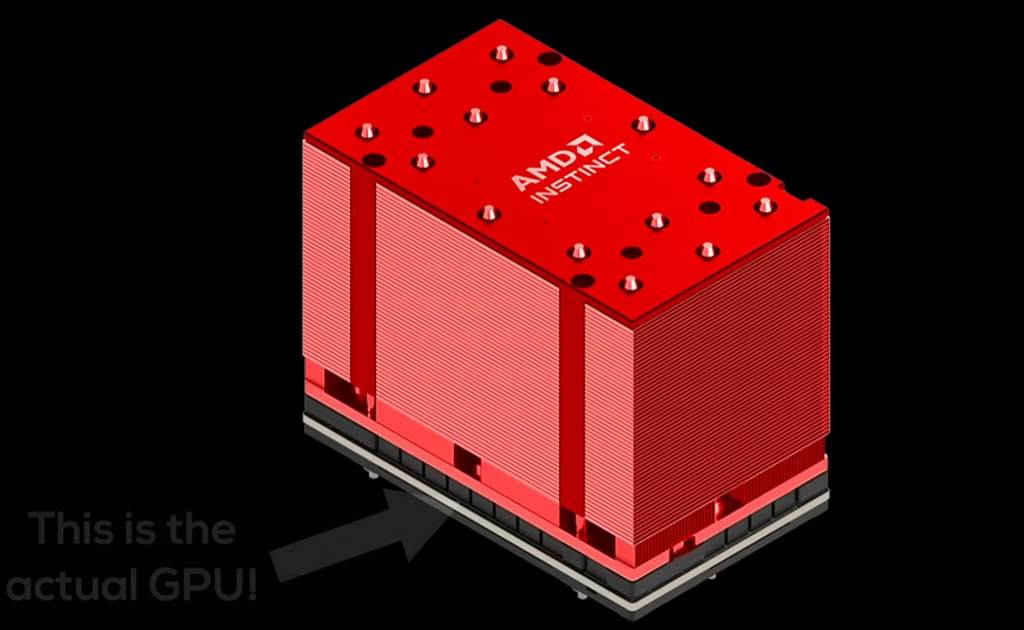
Red is cooling. Bottom is GPU or IT equipment for an AI data centre (super computer)
.
Redoing TCO Model
Use Classic Financial Modelling Techniques like InputC, Timelines with flags, Operating Characteristics and Cash flow
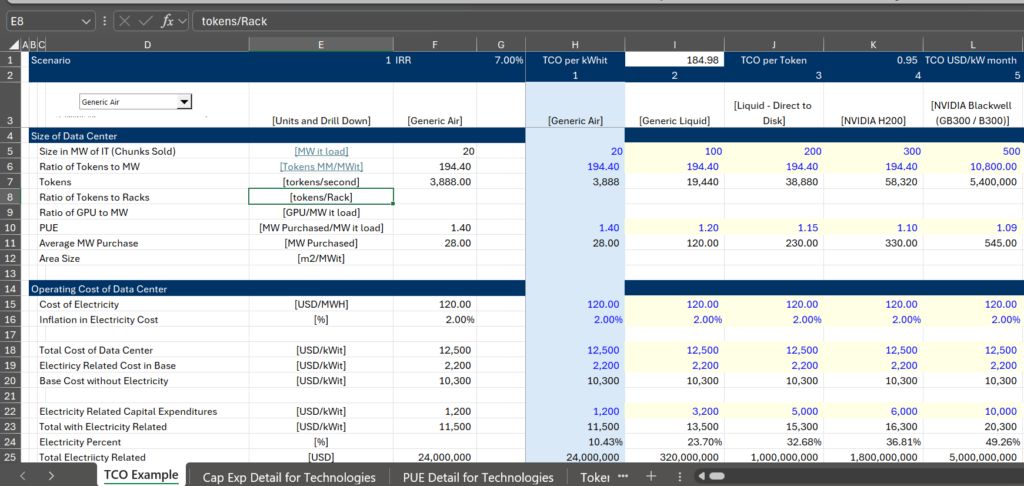
After considering trying to revise the model, I suggested to make a data center model in the context of what are now classic modelling principals including use of InputC with scenarios, use of the INDEX function for selecting scenarios, for development of time lines and flags. When thinking about what kind of model to illustrate to people who have little financial background and The notion of defining databases with different structures and putting units in the InputC is shown below. The database analysis that apply classic financial modelling techniques is attached to the button below. As this file contains macros, you need to unblock the macros after you download the file.
.
.
The manner in which the InputC goes into the more detail is illustrated below. The input from InputC is shown in column F. The model is computed on a monthly basis so things like the date for replacement in months, the construction period in months and other factors can be computed precisely. Note that it is just as easy to make the model on a monthly basis.
.
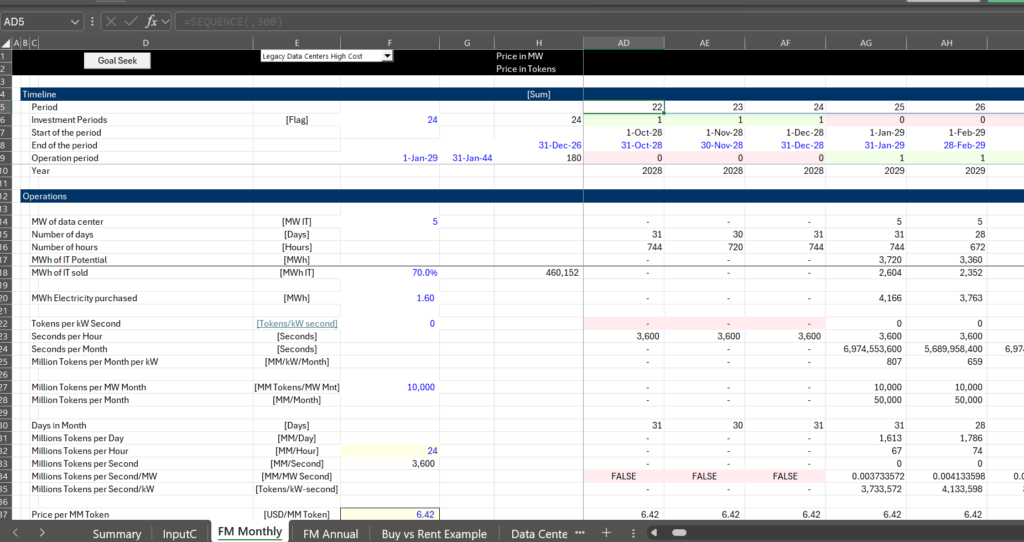
.
The data for capital expenditures, operating expenses, efficiency in PUE, efficiency in terms of tokens is taken by asking AI for the data and then putting the data in a database. This illustrates how AI can provide benchmarks for financial models. I am sure many of you could have done this more efficiently, but I was surprised about how different the results were when I change some small differences in prompts. To resolve this I made a sheet called a drill-down sheet where I included alternative data from different prompts.
.
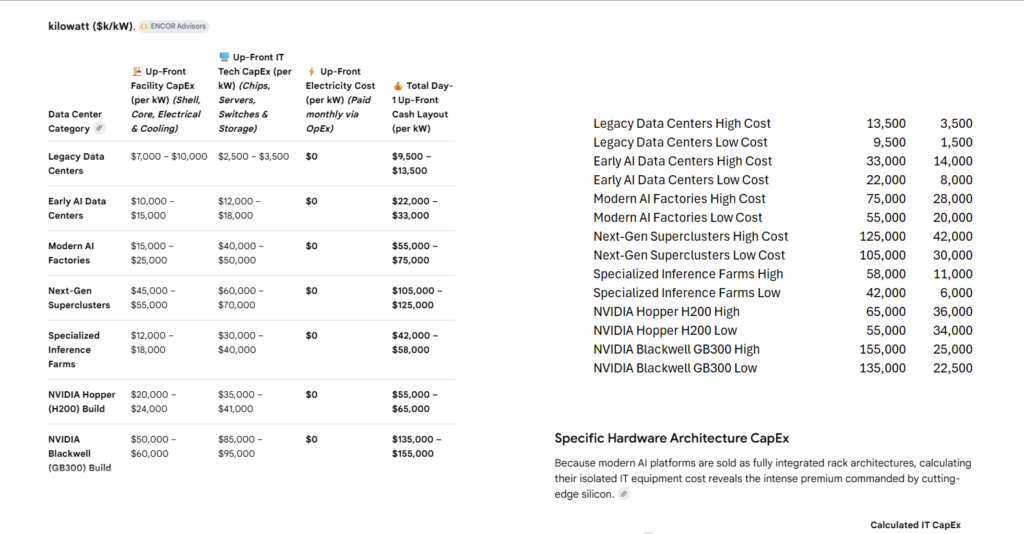
.
Complete Data Center Model
The last data center model includes added data, added tools to store results and more modelling mechanics. In evaluating this model you can in theory address crucial questions about the true computational cost of AI and the question of whether the massive investment in data centres make economic sense. This model includes more detail on different data center configurations, degradation, efficiency statistics that are a function of temperature, drill down on the electricity costs and mechancial costs, better modelling of the capacity in terms of tokens and the utilisation factor of tokens, addition of InputS sheets
.
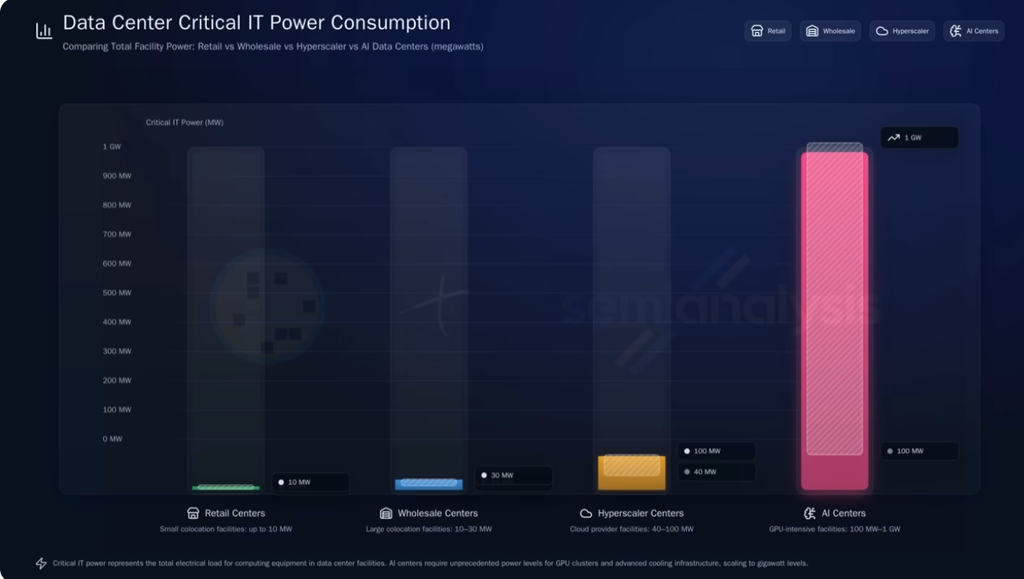
.
.
Database in Model from AI prompts
In addressing the important question as to what is the true ultimate cost of using AI for things like coding that take a lot of tokens, the cost structure of the different data centers is a key issue. I tried to find the data from prompts to AI. But when I asked AI, I received very different responses to some key issues. The first problem was with the total capital expenditures per kW (I define this as kWit which is something like kWp versus kWac for solar, but I made this up). The screenshot below and the graph below that illustrate the difference in cost I that AI gave me from prompts that I thought were the same.
.
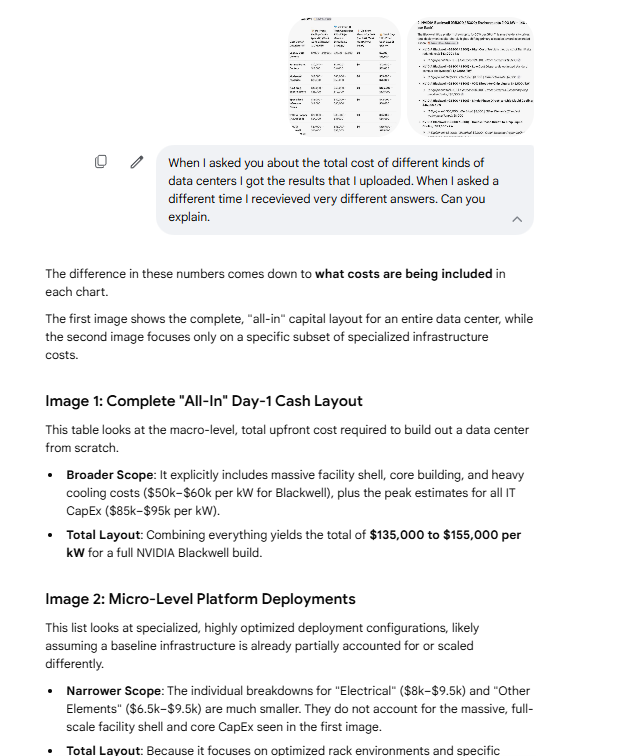
.
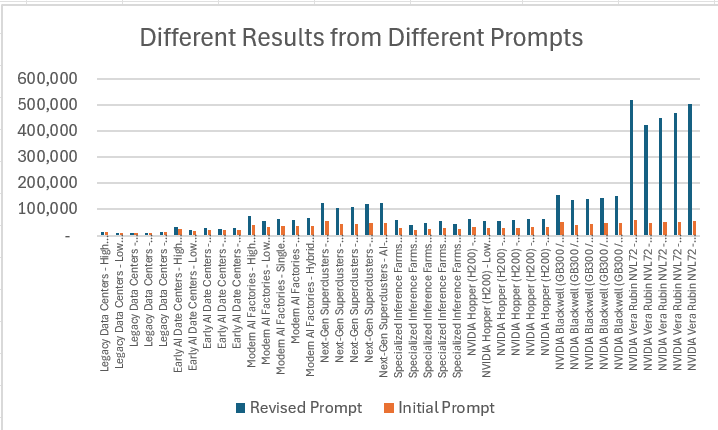
.
A lot of the data that is extracted from the AI prompts is included in the model. I have used CNTL k with range names so you can see the source data. An illustration of the data on capital expenditures that illustrates different components of capital expenditures is shown in the screenshot below.
.
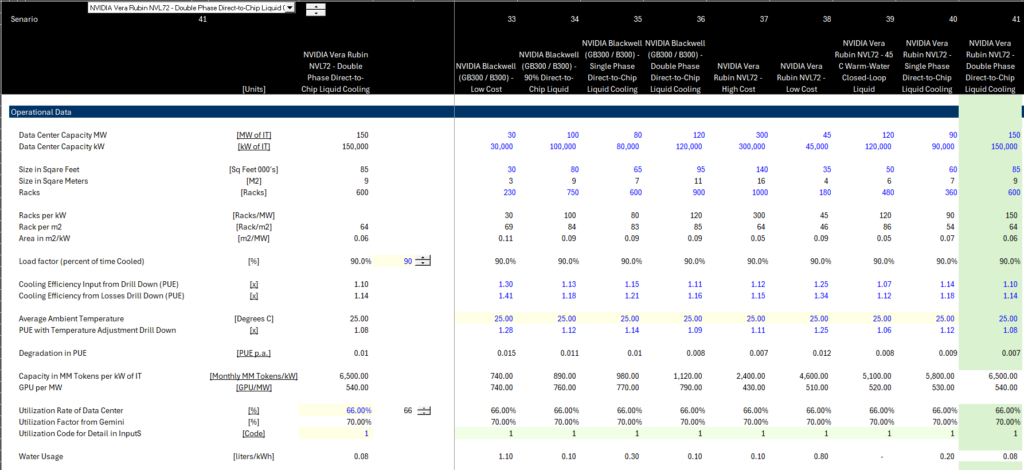
.
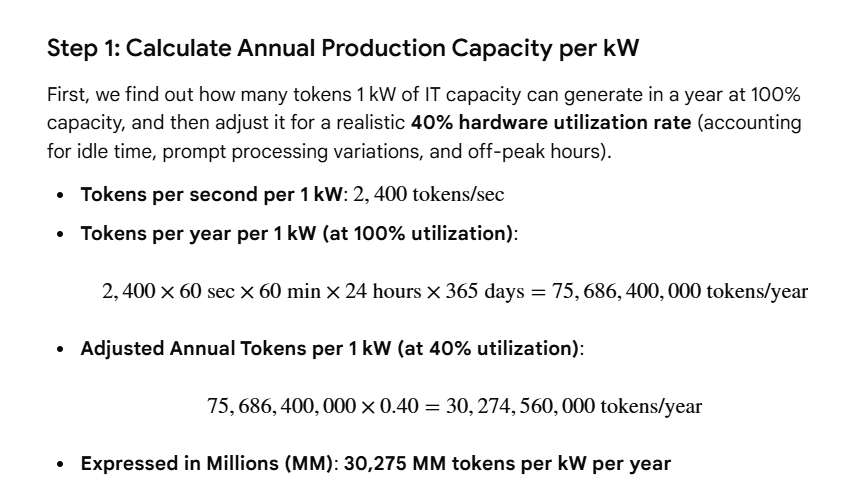
After adding the key issue of the number of tokens per kW I asked again and received the following response.
.
.
The 75,686.4 million tokens per year or 6,307 per month
A second example from the drill down page involves the PUE and efficiency. You can get data on the PUE and also on efficiency and/or losses from different activities as the PUE is the same as 1/efficiency. You can also acquire the PUE for different ambient temperatures. With the data on PUE for ambient temperatures, you can derive a linear (or more detailed) equation where the PUE changes depending on the temperature. The PUE examples are shown in the screenshot below.
.
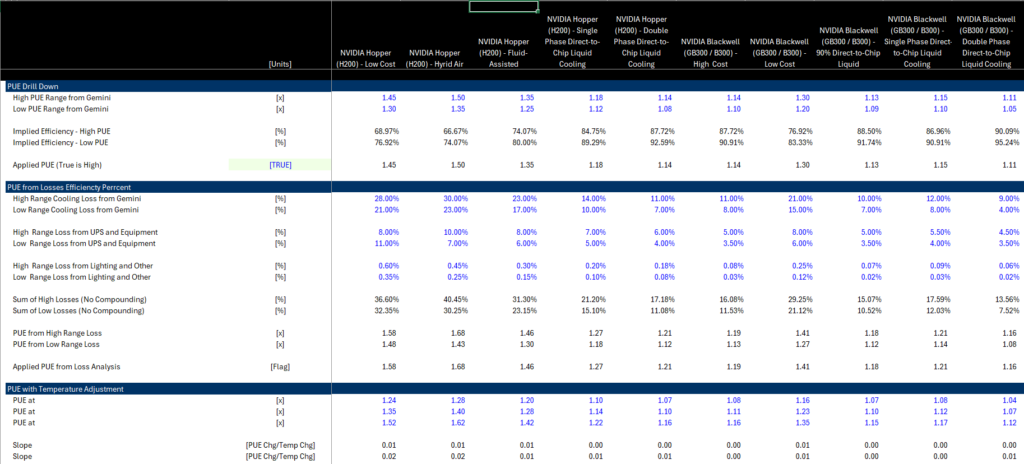
.
TCO with Goal Seek
.
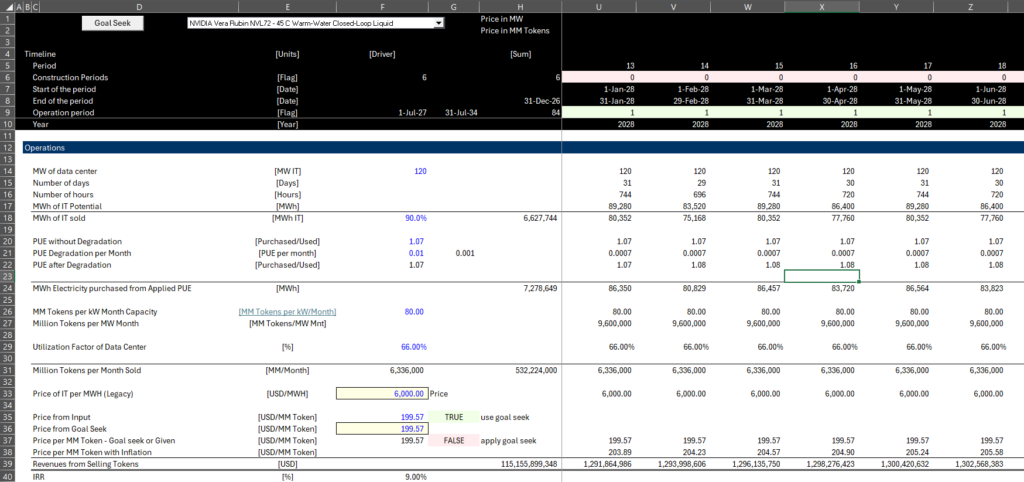
With the InputC and the InputS, a financial model can be developed. Instead with wasting time with filling numbers into a template model as many do, I think it is better to start from scratch. You need to understand how the operation works and in particular how much electricity must be purchased relative to the IT load. It is a little confusing for people like me with background in electricity. In electricity there is one capactiy factor statistic that could be called the load factor. For the data center there is a load factor for purchasing electricity — it may be high, but probablity not 100%. The data centre must be cooled even if tokens are not sold.
It is important to distinguish the load factor from the utilization factor for a data centre. The ratio of million of tokens per kW can be stated in terms of maximum capacity like any hotel or other business. You can think of this as the total rooms that can be sold for a hotel. But this capacity does not mean that all of the tokens will be sold for 24 hours a day and seven days a week. One of the big issues for data centers can be overcapacity that just like it is the big issue for so many other things. The section of the model that works through efficiency and utilitsation factor is illustrated in the screenshot below.
.
.
The operations data is used to compute net cash flows by considering the capital expenditures, the replacement expenditures and the operating expenses. The operating expense and the net cash flow is shown in the screenshot below. Note that at the bottom the NPV of free cash flow is computed at the target IRR. This allows derivation of the total cost of ownership.
.
Scenarios and Presentation
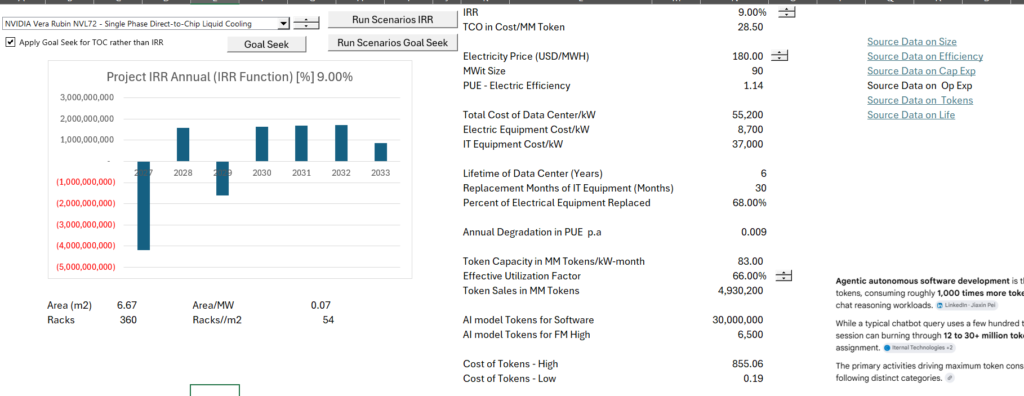
The manner in which alternative scenarios are presented is shown below. You can select either to present the IRR for different alternatives or you can select to present the TCO. The different scenarios are created by clicking on the buttons.
.
.
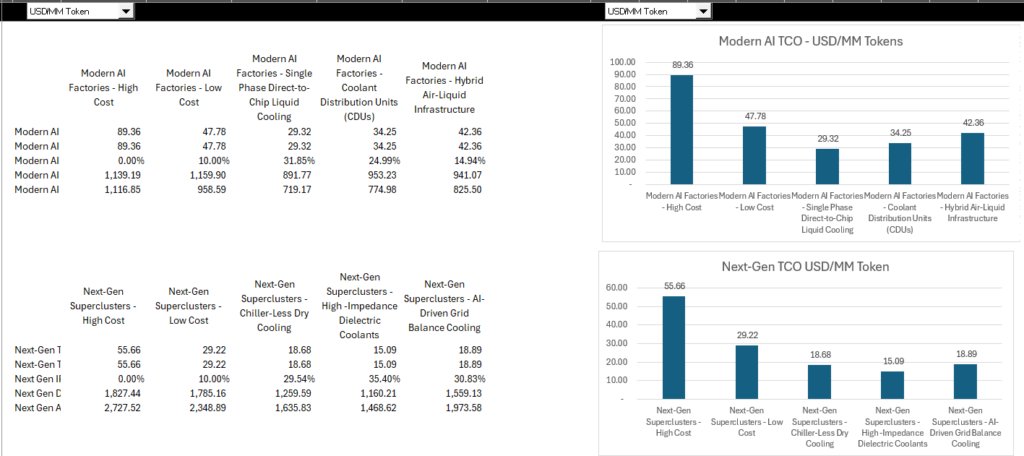
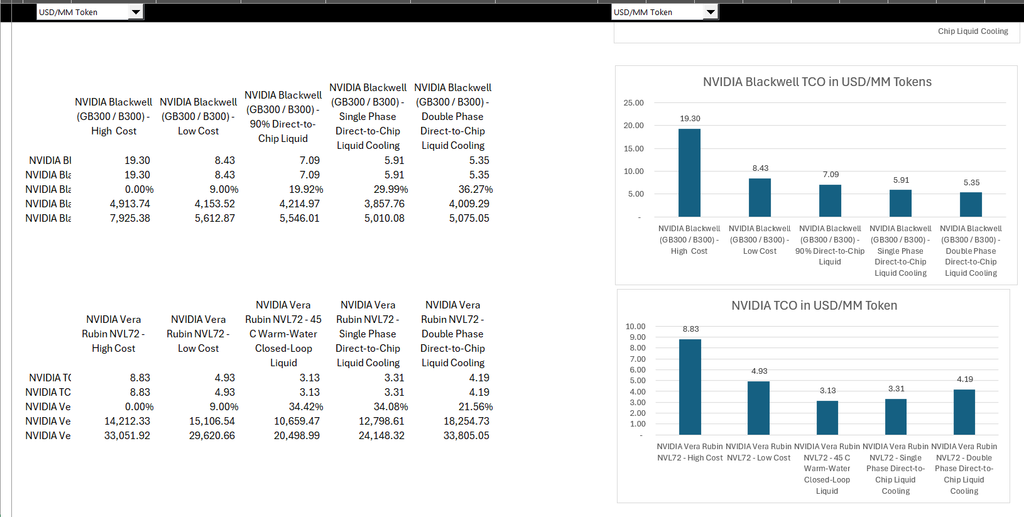
The goal seek macros used to create the scenarios are shown in the screenshot below.
.
.
.
.
Project Finance Analysis
The model does not include taxes and financing. As with any model these should be added after the operations are established. I went to Gemini and asked for pre-sale reports on data centers. I thought that this would allow me to verify crucial inputs such as the cost per kW of the data center and test the results I gathered from AI.
I downloaded the pre-sale reprorts and have attached them to the buttons below. You can use the buttons to see how transactions are structured and how project finance works in the sector,