Economic and financial analysis of batteries in terms of providing storage and ancillary services is introduced on this web page. Storage and battery can add a lot of complexity to economic analysis because you must make some evaluation of the value of benefits from use of the energy when batteries are discharged compared to the costs of charging the batteries and paying for the fixed cost of the batteries. This valuation of discharging batteries less the cost of charging and paying for fixed costs of batteries must be considered over the time period of the battery cycle — almost always on an hour by hour basis. This is complicated by the fact that in electricity analysis, batteries (or hydro plants with storage or other technologies) provide two sources of value — (1) storage over a cycle and (2) ancillary services. The first source of value, storage, is to move energy from low cost periods to expensive periods with charging and discharging which is what happens when you charge your phone or laptop. The second service provided by batteries (or storage hydro) is to back-up the value of servicing sudden and foreseen changes in demand (balancing costs and ancillary services). On pages like this, I tend not to delete old stuff, but I put the newer materials at the top.
Other than evaluating the hour by hour charging and discharging from batteries there are many factors that make battery analysis somewhat more difficult than the evaluation of dispatchable or non-dispatchable technologies. These factors include degradation rates of batteries, the round-trip efficiency of batteries during a charging cycle, the minimum depth of discharge and the lifetime of batteries as measured by the number of cycles. This is on top of the central question regarding how to measure the size of batteries which could be measured by the capacity or the energy. Because of all of these factors, evaluation of the costs and benefits from storage and/or measuring the levelised cost of electricity with storage could seem pretty intimidating. On this webpage I try to show how you can simplify the analysis or at least manage it and then I discuss alternative ways of evaluating the cost and benefit of batteries without some kind of fancy dispatch software.
The points I make about storage energy are included in the power point slides below. I am intending to make a video about this where you must take some quizzes.
.
.
.
Storage and Battery Use Cases
A use case is defined by how you can apply batteries in different situtations derived by the demand. You acquire different batteries depending on the demand. One use case is to manage the charges and discharges for chaging when rates are low and discharging when rates are high. Another use case is for applying the charges and discharges to manage short-term demand fluctations which can be called ancillary services. A third use case is for load shifting where solar power is moved from the day to the night. A fourth use case is to take advantage of differences in merchant prices.
•For Batteries, you may use the batteries for different functions
•Be very careful about assuming that you can use the batteries for multiple functions that depend on:
- Electricity usage over a day
- Electricity usage in very short time periods
- The value of electricity in different periods – merchant
- The sources of supply of electricity (solar, wind and plants with inertia)
.
Short-term and Long-term Electricity Demand as Drivers of the Use Cases
Another use case that I find interesting is serving a data centre with batteries and solar. This would have been considered crazy a few years ago but with the declining cost of batteries it may be considered reasonable. The graph below is something I found on the electricity use for a data centre for a day. Note how the load does fluctuate and you cannot just say that it is 24 hour constant load.
.

.
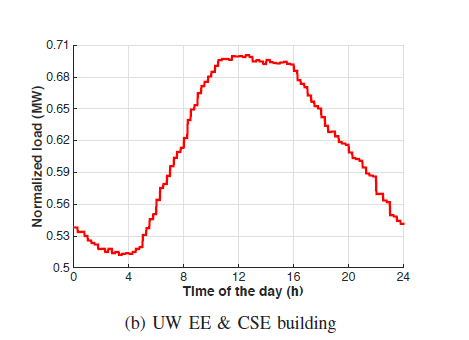
Another use case is for a building that has changing load. Note that the load goes up in the middle of the day when the sun is at its peak. This can be modelled in a smilar manner to a mini-grid and evaluate how much is left to purchase from the grid.
.
.
Characteristics of Battery — Storage Capacity and Inverter Capacity to Apply in Use Cases
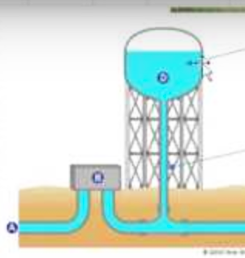
The issue of capacity is illustrated by picture of a water tower below. The capacity to charge or discharge in an instant is illustrated by the pipe leading up to the storage tank.
The amount of energy from one charge is illustrated by the size of the tank.
Think of the pipe as the instantaneous amount of water that can be discharged or charged.
The diagram below of a water tower illustrates the issue of capacity storage and energy. In determining how much storage or ancillary service you need, should you use:
- The maximum amount of electricity that can be sent to the battery or drawn from the battery at any instant, measured in kW.
- The maximum amount of energy that you can take from the battery – the discharge — over a cycle (e.g. a day) measured in kW x time of discharge or kWh. This is also the amp hours Ah multiplied by the volts divided by 1000.
- The maximum amount of energy that you can send to the battery over a cycle – the charge – measured again in kWh.
In the diagram below, the capacity is measured by how much stuff (water or energy) that can be moved through the pipe. This should be measured in an instant, but we can measure this over the course of an hour. This is the kW of a battery. The amount of energy that can be discharged or charged (there is no round trip efficiency from evaporation in the storage tank) is measured by the size of the tank, which can in turn be a multiple of the size of the maximum hourly storage.
.
.
Question to Ponder
•How much storage do you need for short-term demand movements
•If you need 24 hours of storage for a data centre and the solar load is for 6 hours
•Assume the load is 100 MW each hour
- Can you do this with 18 batteries with one hour of storage, each with 100 MW
- Can you do this with one batter with 18 hours of storage (not sure if 18 hour batteries are possible, but assume anyway)
- Can you do this with batteries with 6-hour duration – 3 batteries with 100 MW capacity
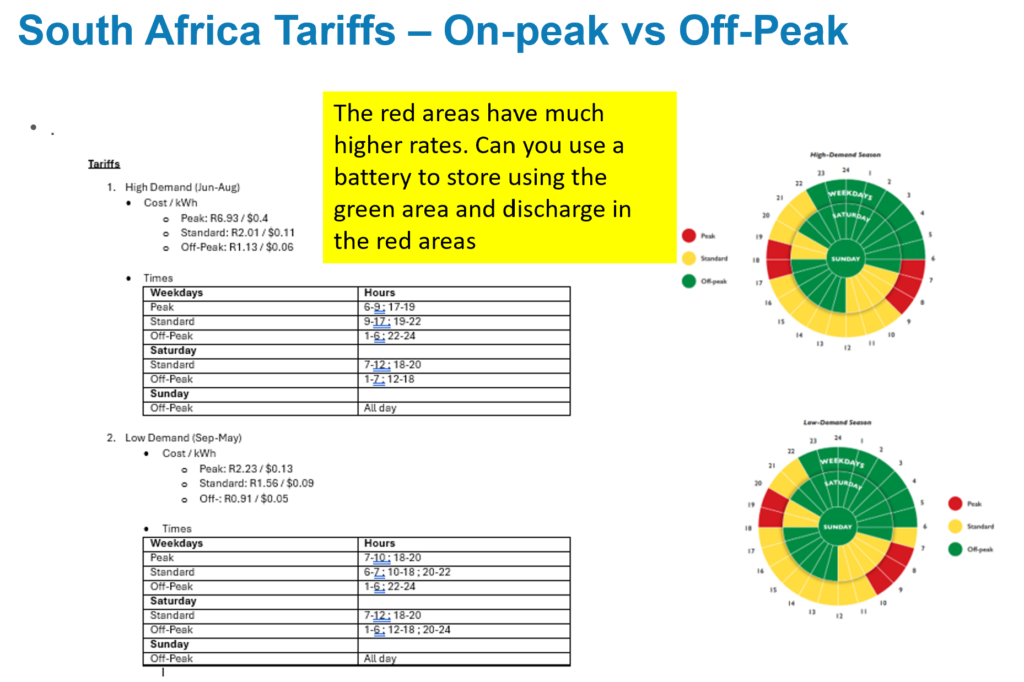
Use Case 1 Example: Retail Rate Arbitrage Use Case and South Africa Retail Rates
A use case that I found interesting and you can think about as a starting point the case where there are large differences between on-peak and off-peak rates. The red areas shown on the right-hand side of the picture below are the areas with very high rates whilst the green areas are low off-peak rates. The question regarding battery analysis is whether you can take charge the using the green areas and store the electricity and then later discharge the Look at the very high rates in the red area and the much lower rates in the green area. Question to ponder, how much storage energy compared to capacity would you need.
.
.
Use Case 2: Ancillary Service Use Case
Note the short-term fluctuations in demand in the graph below. These can cause big problems for the electricity system operator. Point to the diagram below and explain how much would you charge and discharge. After running through the day, would you have a lot of storage in your battery. Do you need to keep the battery charged.
.
.
Use Case 3: Load Shifting Use Case
.
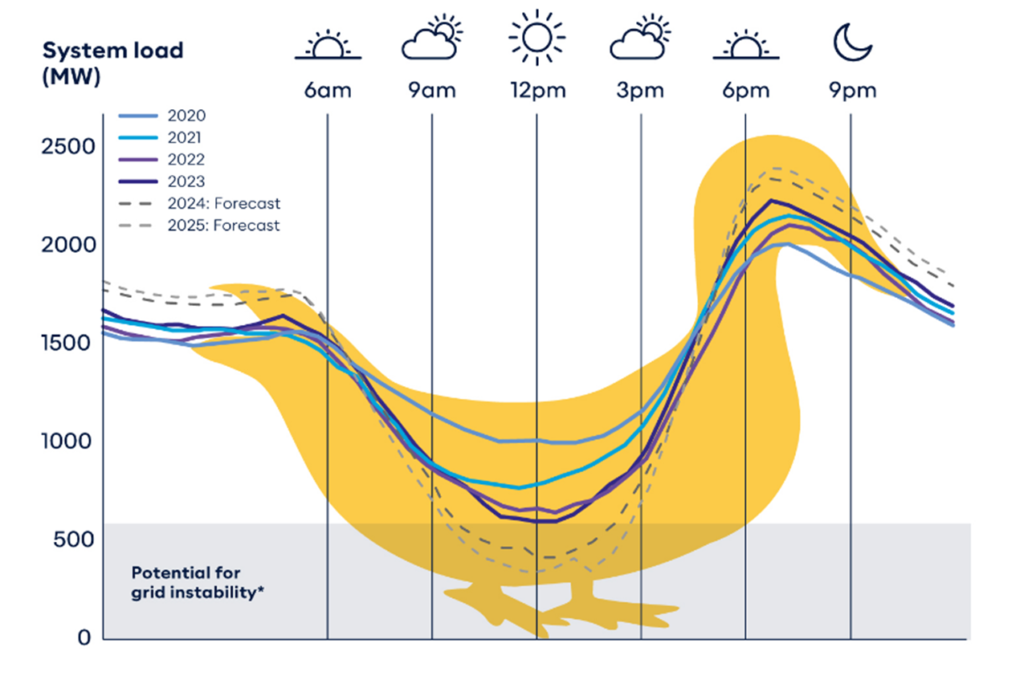
Be able explain the real implications of the Duck Curve. Consider keeping plants operating for when the plants will operate when people return home from driving.
.
.
I have included files I have created for analysis of storage. I have changed the analysis over the years.
.
Power Point Slides Describing Resource Analysis and Financial Analysis of Storage and Batteries
.
.
.
.
Excel File with Hour by Hour Storage Exercise with Dispatch and LCOE Components
.
Drax states: “Energy storage is like bacon: It makes everything better” It is considered one of the most important issues within the energy industry, with “the potential to dictate the pace and the scale of the energy transition”.
In addition to interconnection, demand-side response and flexible generation, storage is the ‘glue’ that could help integrate more renewables by smoothing their intermittent output. This could revolutionise grid management, facilitate deeper decarbonisation and significantly reduce the need for fossil fuels to provide flexibility. Low-cost technologies that store excess electricity for when it is needed are seen as “transformational” and one of the “foundations of clean energy”. Ok. Blah Blah Blah.
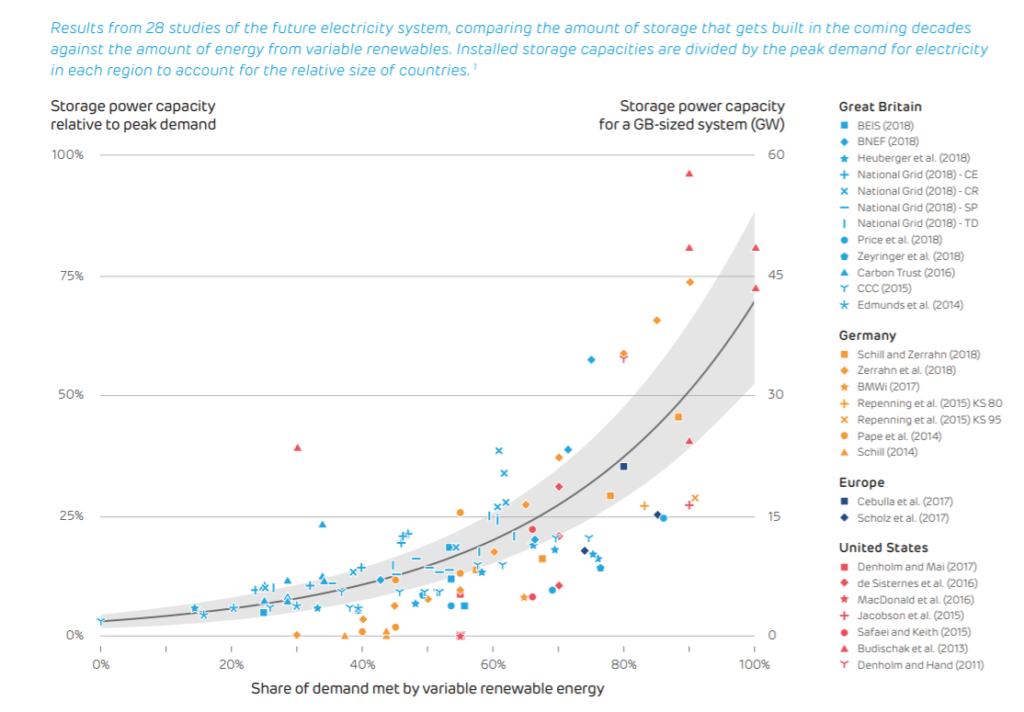
The elephant in the room is inter-seasonal storage. The graph below is from Drax and illustrates the storage measured in capacity relative to the amount of intermittant renewable energy. What the graph does not show is the duration of the storage.
.
Battery Parameters and Cost
The implication of this diagram in a cost and benefit analysis of batteries is that the amount of capacity may be measured in terms of kW or in terms of kWh or in terms of kW and kWh. If the capacity is measured in kWh and the cost is measured in terms of money per kWh, the cost is measured in terms of kWh of charge or kWh of discharge (not the kWh of charge). The difference between the cost in terms of kWh of charge and kWh of discharge is driven by the round trip efficiency. Unlike me (who couldn’t grasp the different measurements of capacity) you should understand that round trip efficiency is related to energy — kWh — and not kW.
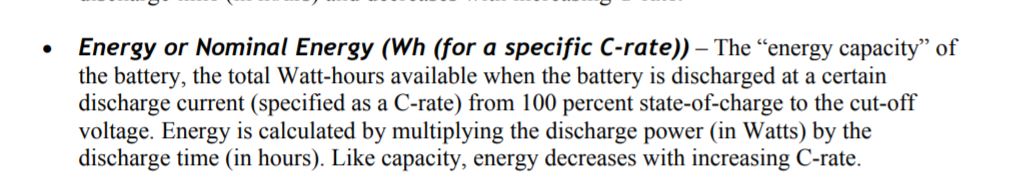
I had to look up whether, when cost is stated in terms of USD/kWh, the kWh is the discharge or the charging energy. Apparently it is the useful charging energy as demonstrated by the quote below. The amount of watts discussed in the quote below is presumably the amount produced at direct current (DC) rather than alternating current.
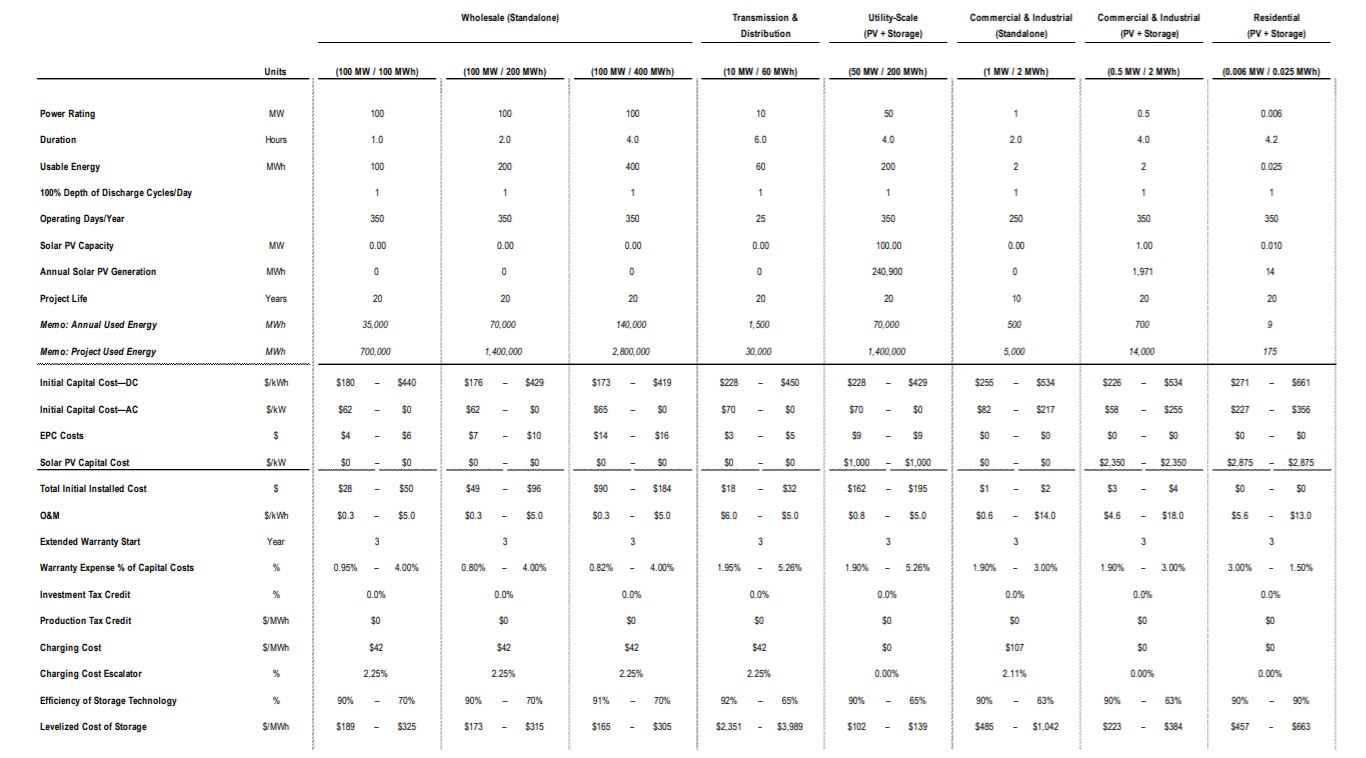
The cost, capacity and operating characteristics of different battery technologies are illustrated in the table below taken from Lazard which is very different from the presentation of battery suppliers. Note that at the top of the table, the capacity is expressed in terms of both MW and MWh. The cost of the project is measured in terms of either USD/kWh – DC (without specifying whether the kWh is discharge or charge) and/or in terms of USD/kW. At the bottom of the table, there is an item called the efficiency of the storage technology which presumably means the round trip efficiency of the battery. The duration is expressed in hours, but it should really be labeled the duration in hours at maximum discharge.
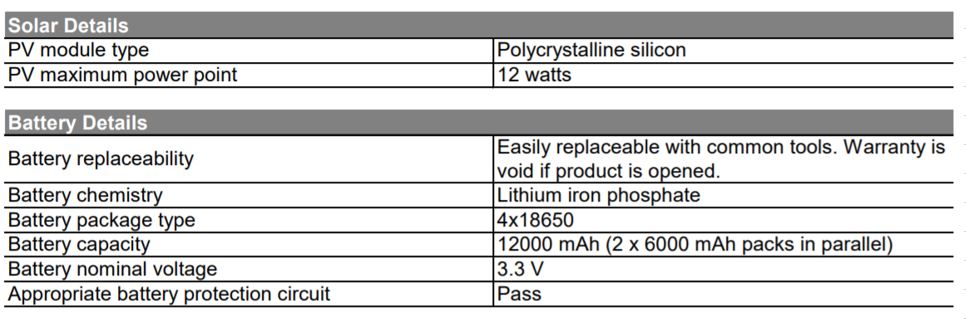
When battery information is provided by suppliers, the information may look something like the excerpt below which is from a small home solar system. Note that the capacity is not recorded and the kWh is also not there. But you can see the battery capacity in terms of mAh. If you look on the internet you can see that an mAh is equal to 1/1000 Ah. Further you can find out that a kWh= Ah x V/1000 or Wh – Ah x V. This means in the example below that the battery capacity in terms of watt hours is 12 x 3.3 or 39.6Wh. This amount of energy is presumably the amount of energy discharged.
An ampere hour or amp hour (symbol: A⋅h or A h; often also unofficially denoted as Ah) is a unit of electric charge, having dimensions of electric current multiplied by time, equal to the charge transferred by a steady current of one ampere flowing for one hour, or 3,600 coulombs.
.
Hour by Hour Electricity Demand Data for Selected Years in Saudi Arabia for Battery Analysis
.
.
Alternative Uses and Business Cases for Batteries
.
Incorporation of Battery Characteristics in LCOE – Ancillary Service Case
Simple Analysis with Demonstration
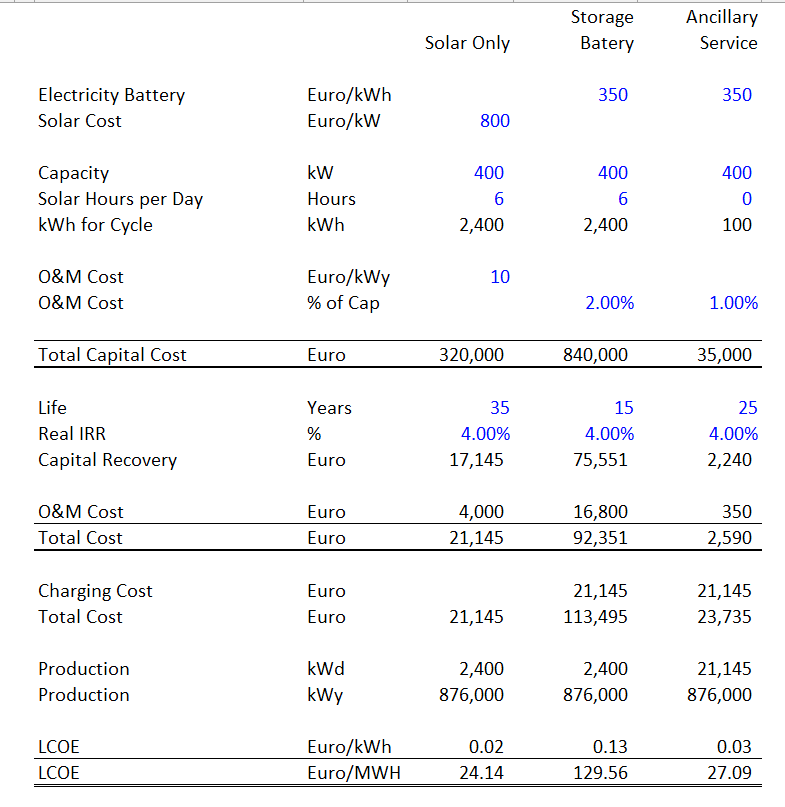
The screenshot below uses a very simple example to demonstrate the economics of battery storage. The inputs include the cost and the life of the battery. Note the increased cost of providing six hours of storage from the battery. The simple example illustrates that high cost of using a battery for a single day of storage. The cost of the battery is dramatically less for ancillary service.
.
Playlist of Batteries and Storage
The set of videos attached to the playlist below demonstrate my various attempts to evaluate the economic cost of batteries. In working through battery issues I have attempted to make differet files that illustrate the cost of storage relative to other alternatives. I hope that as I have worked through the issues the dispatch analysis of batteries combined with the cost analysis is becoming clearer. As with the other playlists, watching all of the videos would be torture and impossible to do. But if you want some help sleeping maybe you can turn on the playlist. I have also included the power point slides that I sometimes refer to when working through the battery issues.