This page has exercises and other files (utility files and database files) that I use for renewable energy courses. The files to download below include power point slides, excel files that work through technical issues with solar, wind and batteries and excel analysis files that include lcoe, risk analysis (P90 etc.) and debt structuring. I have also included some terms and a brief outline for the course for your expectations — the course generally begin with some technical issues with solar and wind and then move to LCOE and financing followed by storage and related PPA issues. Excel files are designed to create practical exercises where you can get your hands dirty and see how some of the key concepts work without wasting too much time with typing in data. The financial issues cover issues that include creation of a simple financial model to demonstrate the proof of levelised equations; equations that demonstrate the importance of debt sizing and debt structuring; exercises that show how risks as measured with P90, P99 etc. are computed and can affect the debt structuring.
The file attached to the blue button below is the course outline. I sometimes change the outline and include hydrogen and more subjects realted to project finance such as re-financing and selling the after the risk declines. If you are working through the course by yourself you can see the subjects that are covered and then later use the power point slides and the excel files to more fully understand the subjects.
.
.
Quiz questions
- What does STC Stand for
- What is the definition of STC
- Can STC be achieved in a single hour
- What is the essence of performance ratio
- What are risks in measuring the performance ratio
- What is the biggest risk in evaluating the performance ratio
Power Point Slides for the Course
The power point file attached to the button below includes slides that work through some technical details of solar, wind, integrating battery storage and then developing LCOE and Financial Analysis. If you are a banker or a developer or investor, I believe it is useful to get you hands dirty [se salir les mains] with some technical details such as the temperature coefficient, the wind shear facor, the shape of the power curve, the reason for DC versus AC capacity even if you would never dream of making any of this technical analysis. The technical details are explained in separate sections of the power point slides attached to the button below. The PPT slides begin with technical details and then move to LCOE and then move to financial models. This is done first for renewable energy (wind and solar) and then for battery and storage analysis. I use this PPT file for the first section that works through LCOE and ultimately evaluates whether solar and batteries in some regions can compete on a stand-alone basis for data centres.
.
Primary Excel Files for the Course
I have created three excel files that accompany the power point slides and are designed to go with the course. The first file is a long-term analysis that contains solar and wind data from different sights that is obtained from http://re.jrc.ec.europa.eu/pvg_tools/en/tools.htm. With this file you can evaluate hourly, daily, and annual weather data that drives the risk and economic analysis. The second file is a smaller file that contains analysis of one year with details on performance ratio for solar and power curve and wind shear for wind. This file is used to illustrate different risks that arise from technical details. The The files below I compare the costs of alternative technologies. I demonstrate that the Lazard website on LCOE can be boilded down to a few key drivers of cost including the capital cost, the operating expenses, the capacity factor and, importantly, the cost of capital. The file ultimately compares the cost of renewable plus battery with other alternatives.
.
.
.
.
Other Files Used in the Course — Credit Write-up Example, Term Sheet Example, Financial Model Example, IRR Analysis
Credit Analysis of Renewable Energy
The file below is an example of how a bank can evaluate credit of a renewable energy project (a solar project). The file attached to the button below demonstrates how bankers may have a lot more data in evaluating the risks for the developer than the developer itself. Bankers compare the resource analysis with other studies including P90 etc. to other projects and use engineers to assess the technology risks of equipment with proven technology. You can see how the data is adjusted from data that is presented by the developer including resource, degradation, operating and maintencance expense and other items.
.
Example of Analysis of Solar Project with Independent Engineer and Sensitivity Analysis
.
Debt Financing and Term Sheets
The file attached to the button below includes a term sheet that we use in the course to understand and not be intimidated by various elements. The term sheet includes maximum debt to capital and minimum DSCR. The file is used in the course to as a basis for debt structuring and evaluation of different financial issues. The file attached to the first button is an example term sheet. If you work through the document and understand the language it would be a good thing to do.
.
PDF File with Term Sheet for Loan Agreement that Illustrates Various Financial Structuring Items
.
PPA Agreements
PPA agreements can be a big part of defining risk as the PPAs are centered around defining incentives for the developers who should take risks for items that they can control. Battery PPAs are discussed using actual expamples — three examples that are public or disguised. The PPAs depend on the characteristics of the projects and who controls how the output works. For batteries, the offtaker who is paying for the battery service controls how the battery is used — how many cycles etc. which is the reason the contract is a take or pay and not a take and pay contract. The PPA contracts are capacity based contracts where the revenue does not depend on the amount of discharged capacity since the discharge is determined by the PPA buyer and not the seller (the investor). The PPA contracts raise risk allocation issues. The three PPA contracts include:
.
.
PDF File with PPA Example Number 2 - Entergy Template PPA with Battery and Solar for BOT
.
PDF File with PPA Example Number 3 - India PPA Terms that were Included in Request for Proposal
.
Actual Financial Model
Participants are often interested in interpreting financial models rather than constructing the models. You want some understanding of the equations of the model, how you can use the model for performing your own sensitivity analysis and looking around the model to verify how the model works to compute things like shareholder equity returns. The button below links to an actual model that may seem intimidating at first; but after you work through some of the inputs and understand what is going on, should be bearable.
.
Excel File with Model Structure and Equations with Monthly and Semi-Annual Timing Etc.
.
Earned IRR’s on Different Kinds of Things
The file attached to the button below demonstrates stock indicies, stocks and economic variables derived from finance.yahoo and FRED. The file extracts data from different stocks and demonstrates what the earned IRR is. A fundamental philisophic question is how and why the IRR or the growth rate on stocks is above the growth rate in the overall economy (meaning that investors get rich and non investors become more poor). The file attached to the button below allows you to see the achieved growth rate including dividends for differnt indicies, stocks and economic indicators.
.
Excel File that Uploads Stock Price Data from Finance.Yahoo Economic Data from FRED using Python
.
Case Study on Orsted to Demonstrate Valuation, Project Finance and Resource Concepts
The files below include a case study of Orsted. I believe this case study is effective in discussing corporate finance versus project finance and valuation concepts surrounding project finance. The first button includes power point slides that work through the case. The second file is an excel file that analyses data provided by Orsted. The second file below is data that was provided by Orsted after the problem with its projects in the US where costs for leasing the land were not covered by fixed contracts and the project experienced delays and increased costs and was cancelled. The second file below is an excel file with analysis of corporate finance from ratios of ROE, ROIC, P/E, EV/EBITDA and price to book ratios. The file is used to contrast project finance with corporate finance.
.
.
.
.
Some Terms Used in the Course
•Internal Rate of Return
- Technical Definition: The discount rate that makes the present value of cash flow equal to zero
- Intuitive Definition: The growth rate in cash flow where dividends or intermediate cash flows are invested at the same IRR
•Net Present Value
- Technical Definition: The accumulated value of future cash flows, where future cash flows are discounted using the cost of capital: 1/(1+cost of capital)^period
- Intuitive Definition: The sum of cash flows, where future cash flows are given lower value than current cash flows because you like current cash flow better and because future cash flow are reduced because of risk.
•Cost of Capital
- Technical Definition: The minimum acceptable return for an investment given the risk of a project, often measured with the capital asset pricing model and beta.
- Intuitive Definition: The smallest growth rate (IRR) in your money that is acceptable to management when bidding for a project
•EBITDA
- Technical Definition: Net Income before deducting interest, before deducting interest, before deducting depreciation and amortization
- Intuitive Definition: The cash coming into your pocket from earning revenues less the operating expense that comes out of your pocket.
•Debt Service
- Technical Definition: The sum of interest expense, debt repayment and fees post the COD
- Intuitive Definition: The growth rate in cash flow where dividends or intermediate cash flows are invested at the same IRR
•CFADS
- Technical Definition: Cash flow available for debt service which includes EBTIDA less taxes and less working capital changes
- Intuitive Definition: The amount of cash coming into the project before the money you have to pay the bank computed over the period you are paying the bank
•Debt Service Coverage Ratio
- Technical Definition: The ratio of cash flow available for debt service divided by the debt service
- Intuitive Definition: The buffer of cash flow above you pay to the bank as a safety margin to protect the bank from lower then expected cash flow
•IDC
- Technical Definition: Interest cost incurred during the pre-COD period that is allocated on an accounting basis to capital expenditures
- Intuitive Definition: I don’t care
•Capacity in Direct Current (kWp, or MWp)
- Technical Definition: The capacity of a panel measured at standard testing condition
- Intuitive Definition: The amount of capacity that would be produced if there was a situation where 1,000 watts per meter was hitting the panel and the temperature on the panel was 25 degrees (two conditions that together will almost never occur).
•Capacity in Alternating Current (kWac or MWac)
- Technical Definition: The amount of electricity measured from the relative amount of AC to DC
- Intuitive Definition: The maximum amount of electricity that can be delivered to the power grid from the inverter.
•Energy Yield
- Technical Definition: The accumulated amount of energy generated over a period divided by the capacity of the project
- Intuitive Definition: Simply the amount of generation divided by one of the definitions of capacity above that gives you how many hours the project is operated at full capacity.
•Capacity Factor
- Technical Definition: The percentage of capacity that is used
- Intuitive Definition: The average amount of production over a period of time divided by the maximum amount – like the number of seats occupied in an airplane divided by the total number of seats on the plane.
•Levelized Cost of Electricity
- Technical Definition: The cost of electricity including the return on investment (the IRR) spread over the lifetime of the project. The LCOE can be defined and NPV of Revenues/NPV of Generation; NPV of Costs divided by NPV of Generation; the weighted average price over time where the weighting uses present value and the relative amount of generation
- Intuitive Definition: The cost of electricity from wind or solar that you can compare with the price of electricity in your electricity bill
•Weighted Average Cost of Capital
- Technical Definition: incremental debt cost after weighted at the debt to capital percent and the cost of equity measured with CAPM weighted at the market equity to market equity plus debt
- Intuitive Definition: A constant required minimum growth rate percentage less than the target equity IRR
•Equity IRR and Project IRR
- Technical Definition: Project IRR computed from free cash flow to the project after tax and the equity cash flow is computed from the equity cash flow.
- Intuitive Definition: The project IRR is the growth rate if there is no debt and the equity IRR is the growth rate from taking money out of your pocket compared to getting money back in dividends.
•Return on Invested Capital
- Technical Definition: EBIT x (1-tax rate)/Invested Capital
- Intuitive Definition: The rate of return to all investors (debt and equity) for a single period measured from accounting data that is used to evaluate the performance of a company. When the return is above the cost of capital, the business activity is generating value for the owners (who could be people of a country).
•Return on Equity
- Technical Definition: Net Income/Equity Capital
- Intuitive Definition: The rate of return to equity investors for a single period measured from accounting data that is used to evaluate the performance of a company. When the return is above the cost of equity, the business activity is generating value for the owners (who could be people of a country).
•P90 or P99
- Technical Definition: Level or a variable such as generation of solar or wind that is enough below the average level (the P50) so that there is a 90% percent chance of being above the level. The level can be computed with NORMINV.
- Intuitive Definition: A downside case with that may or may not be base on objective statistical data.
•Mean Squared Error
- Technical Definition: A method for computing standard deviation from different sources such as weather and making errors in modelling and estimating samples. Standard deviation can be combined by first squaring the individual components and then summing the amounts. Then, you take the square root of the sum.
- Intuitive Definition: A downside case with that may or may not be base on objective statistical data.
•Debt Sculpting
- Technical Definition: Computing the debt repayment in a way such that the DSCR is constant or a changing DSCR is met. Can be computed with the formula DS = CFADS/DSCR and Repayment = DS – Interest.
- Intuitive Definition: A way to resolve problems with seasonality or expected changes in cash flow.
.
More Technical Exercises and Discussion of Renewable Resources, Storage and LCOE
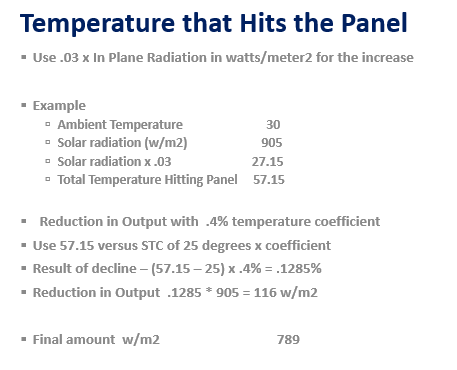
The next files have different illustrations of resource analysis primarily using hourly data in PVGIS from the EU. This website includes hourly solar irriadiation as well as hourly data for wind speeds. The files demonstrate how to compute detailed resouce analysis with temperature coefficients and adjustments to wind speed to evaluate the uncertainty of the resource and present the hourly capacity factor.
.
.
.
.
Excel File with Hourly Detail that Includes Temprature Coefficient, Performance Ratio and Wind
.
.
.
We will use power curves and you can find them at the link below. I put this link here because sometimes I forget about how to find the file and it is one of the rare places you can find data on power curves without paying for them.
Prior Materials
.
I have included power point slides that I very briefly review in the course. The slides cover the same subjects that are in the exercise files and provide documentation. The first power point attached to the button below addresses the general subjects that I cover.
.
.
Power Point Slides for Renewable Energy Course Part 1 - Overview of Issues in the Course
.
.
.
.
.
Databases
There are a whole lot of databases that we may use. Some are for financial data like returns. Other files are for data that has volatility. I have included selected updated databases that demonstrate some concepts in the course. The first is a database from PVINSIGHTS.com. Other files are for commodity prices and for interest rates.
File with Database of Solar Costs from Scraping the Website PVINSIGHTS and then Re-Formatting
.
.
Database for Commodity Prices with Option to Update - Comes from World Bank Pinksheet File
.
Database for Interest Rates with Option to Update - Comes from Federal Reserve Database File
.
Example of PVSYST Output Report With Example of Output for P50, P90 and Standard Deviation
Working File for Levelised Cost of Electricity Analysis with Solar Data and LCOE Calculations
.
..
Excel Utilities to Make Excel Exercise Work More Smoothly and Reading PDF
I have included two files that are used to make the excel exercises work more smoothly. The first is a file called Read PDF which allows you to grab data from PDF files and then convert the data to excel files. To run this file you copy stuff from the pdf file and then operate the macro with SHIFT, CNTL, A. When you copy data from a PDF to excel, make sure that you copy and paste special as UNICODE text. There are different formats that you can use to resolve the PDF. If you are reading from the Lazard LCOE stuff you can use the first green box. If you are reading from the PVGIS you can use the second green box.
The second file is a file that has a whole lot of macros to prevent you from wasting time on formatting and copying formulas to the right. This file is called GENERIC MACROS. I have revised the generic macro file in the link below so that you are not prevented to open it because of something called the auto open — a macro that operates when you open the file and excel considers dangerous. When working through the exercises, it would help a lot if you have this file open and enable the macros. The big things that this GENERIC MACRO allows are to press SHIFT, CNTL, R to copy to the right and also CNTL, ALT, C to open the window that has a whole lot of formatting options. There are a lot more utility macros in the GENERIC MACROS file. You can go to https://edbodmer.com/excel-utilities-and-backpack/generic-macros-file/ and see some of the other stuff including a few user defined functions.
.
.
.
Files to Download with Blank and Completed Exercises
In presenting the exercise files below, I first put the exercise file with blanks to download and then I put the file with the completed exercise. In working through the course, we will use the blank file for each session so that you can get your hands dirty and see how things work. The exercise file with blanks is the first file. In each file I have included a little comment button the explains the objectives of the particular exercise. There are five sets of blank and completed exercises. The first part works through LOCE issues and basic financial modelling. The second part addresses risk issues and things like calculating and then applying P90 etc. The third exercise deals with nuances and upsides from project finance analysis covering things like development fees, re-financing and selling of projects. The fourth exercise covers basic and then more advanced issues associated with batteries and storage. The fifth and final exercise covers hydrogen from the purchase of energy to produce hydrogen to downstream costs to the costs of vehicles and other uses of hydrogen.
,
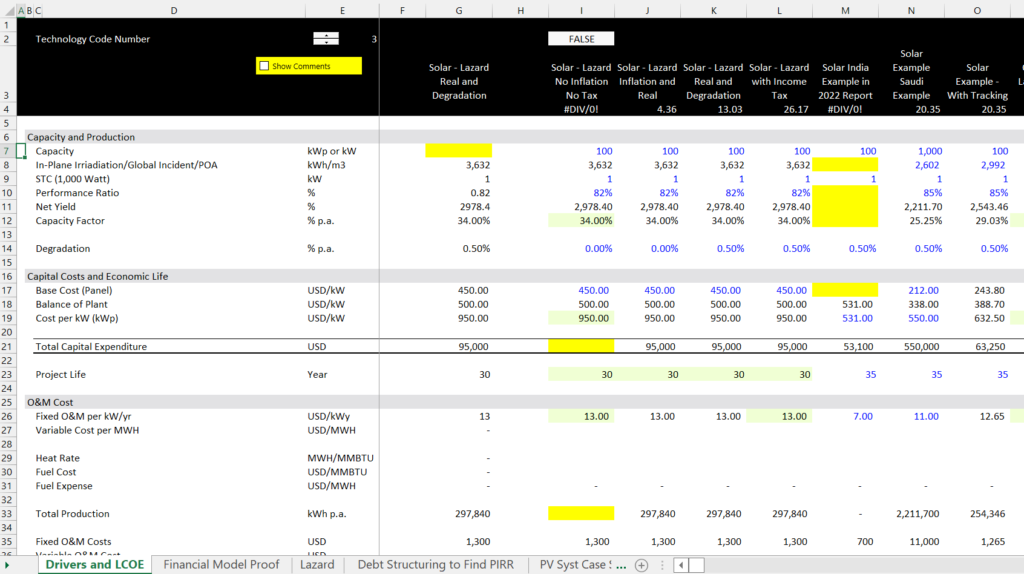
Part 1: Exercise on LCOE and on Financial Model
The first exercise demonstrates calculation of LCOE using the PMT function and the exercises demonstrate how a correct calculation of LCOE can be proven with a project finance model. Reconciliation of the LCOE with a Simple Project Finance Model demonstrates the importance of calculating Real LCOE, that is the implied price that inflates over time. In the exercise , you work through some yield calculations for solar and some power curve calculations for wind. Then you start with some equations from a real financial model. You also work through the equity IRR target to derive the project IRR. To fill in the exercises, download the second file. The first file has the completed exercises. The exercise for computing the LCOE is illustrated in the screenshot below. You will fill in some of the blanks to understand how to compute LCOE. A second sheet will take you through a basic financial model and project returns. Other sheets will address resource issues and debt sizing to compute equity IRR.
.
.
The exercise files to download are below. The file attached to the top blue button should be downloaded for the class — it has the blanks with yellow. If you want to see the completed exercise (I could have made mistakes in my own exercise) you can download the file attached to the second button.
.
.
.
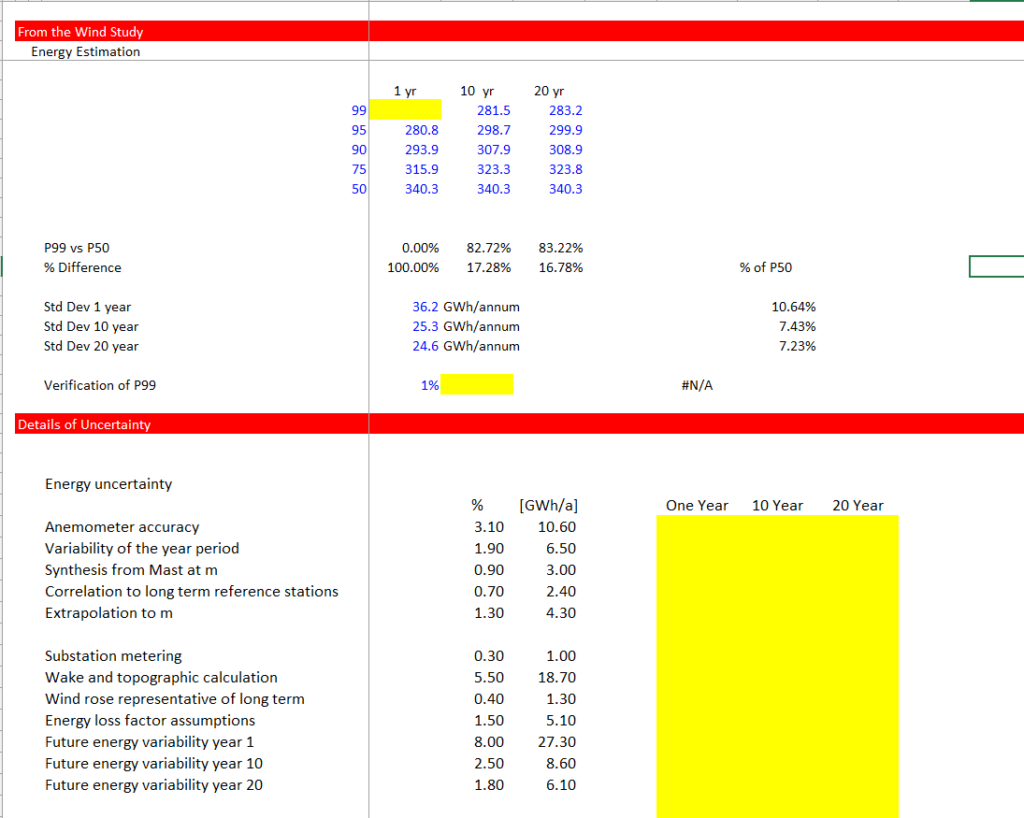
Part 2: Exercise on Risk Analysis Illustrating Calculation of P Values and Judgement in the P Values
The second exercise addresses computations for risk analysis. This exercise demonstrates how to compute P values using NORMSINV and use mean squared error to add up standard deviation from different (independent) sources. It also includes a financial model that demonstrates how the risk analysis affects the returns to equity investors through debt sizing. The type of exercise for you to complete is illustrated in the screenshot below.
.
.
As with the first exercise, the button attached to the first file is the file with equations for you to fill in. The second button is attached to the file with the completed exercise.
.
.
.
.
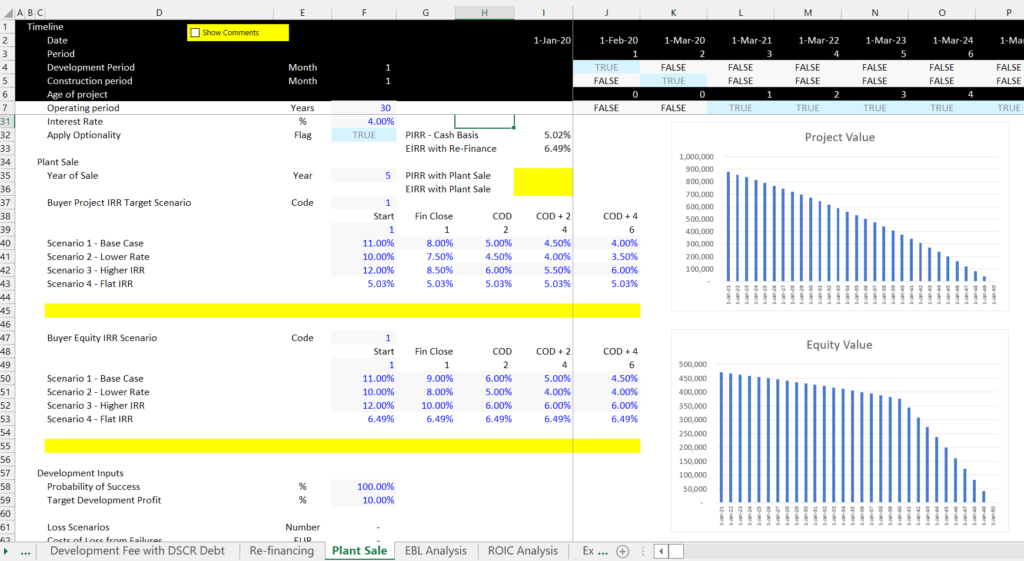
Part 3: Nuances and Upside in Project Finance
The third exercise has more nuanced issues for project finance analysis. The general idea of this exercise is to demonstrate that the IRR in the initial analysis is just a first step. Because the risk of renewable projects declines, it is possible to realize upsides. These upsides include use of development fees, use of re-financing and use of the sale of a plant to investors who are interested in paying for safe investments. This third exercise also includes the true definition of IRR, the theory of development risk and development fee; upside option from re-finance; the upside option from selling a project; computing performance measures and equity bridge loans. As with the first exercise, the first file is completed and the second exercise has equations that you should fill in.
.
.
As with the first exercise, the button attached to the first file is the file with equations for you to fill in. The second button is attached to the file with the completed exercise.
.
.
.
.
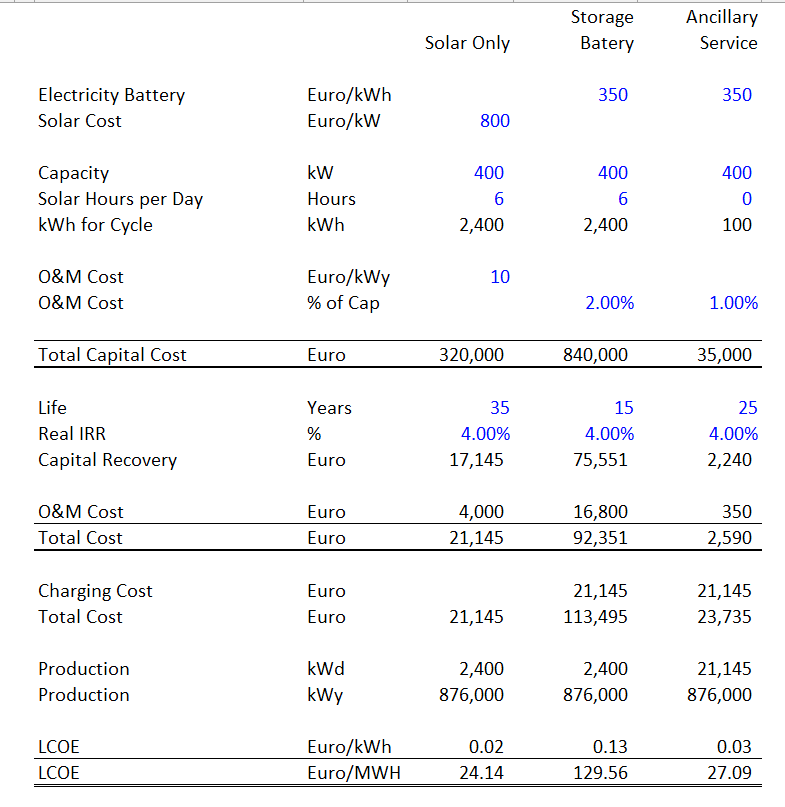
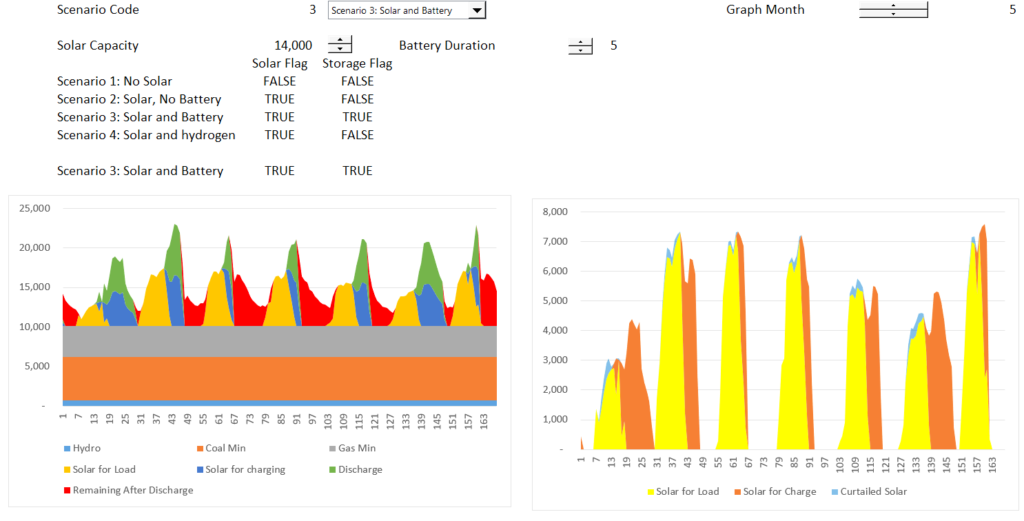
Part 4: Storage Analysis Exercises
The fourth set of files works through exercises for electricity storage and renewable energy. This includes a simple exercise with levelised cost of storage. Next you gradually work through more and more complex exercises that include things like depth of discharge and round trip efficiency. The exercise includes analysis of and then an exercise where you have to work through hour by hour charge and discharge of batteries As with the first exercise, the first file is completed and the second exercise has equations that you should fill in.
.
.
As with the first exercise, the button attached to the first file is the file with equations for you to fill in. The second button is attached to the file with the completed exercise.
.
.
.
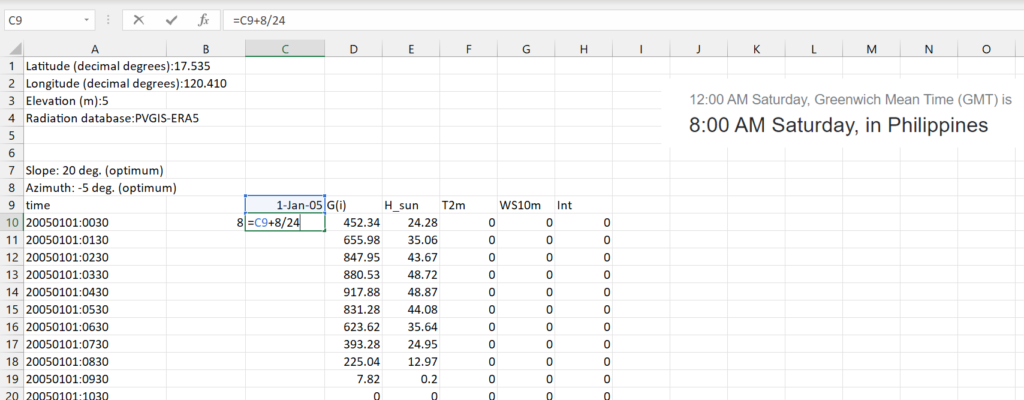
In addition to the above exercises, I have included a file in this section that demonstrates how to work with hourly solar data from PVGIS. In this file I use hourly data that you can download and demonstrate how the hourly data conforms to the summary data presented in the PVGIS website. In the file, you can see that the annual kWh per meter squared conforms to the sum of the hourly data over many years. In the file I also show how to work with dates so that you can quickly perform the analysis. The screenshot below the button for the example file shows that how to set dates after downloading the data. You should first establish the correct starting point that depends on GMT and then add 1/24 to the rest of the dates. As illustrated in the screenshot, this method of adding 1/24 to the date gets the data and the time.
.
Excel File that Demonstrates how to Analyse and Reconcile Hourly Data from the PVGIS Website
.
The next screen shot illustrates how to fill in the rows for dates and time in a few seconds. You can use the formula =if(prior=24,1,prior+1) for the hour in the day and also use the SHIFT, CNTL 2 to get the time.

.
.
Part 5 – Exercise on Hydrogen Analysis
.
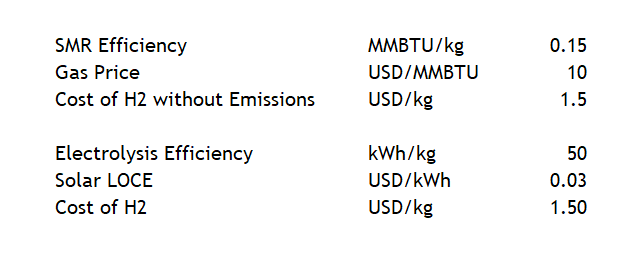
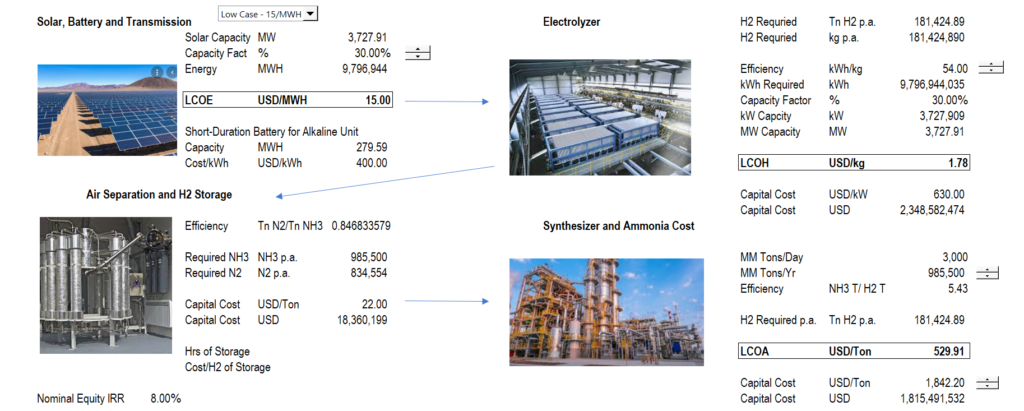
The fifth exercise addresses economic issues related to use of hydrogen for different types of energy production and the use of renewable energy to produce the hydrogen. I have put the hydrogen analysis as the final part because hydrogen production involves (1) understanding of levelised cost of different resources (2) financing and computation of the real cost of capital; (3) evaluation of storage; and (4) understanding of the capital and operating cost of different technologies including electrolyzers; steam methane reactors (SMR); ammonia synthesis; electric and fuel cell vehicles and as well as other costs such as distribution of hydrogen.
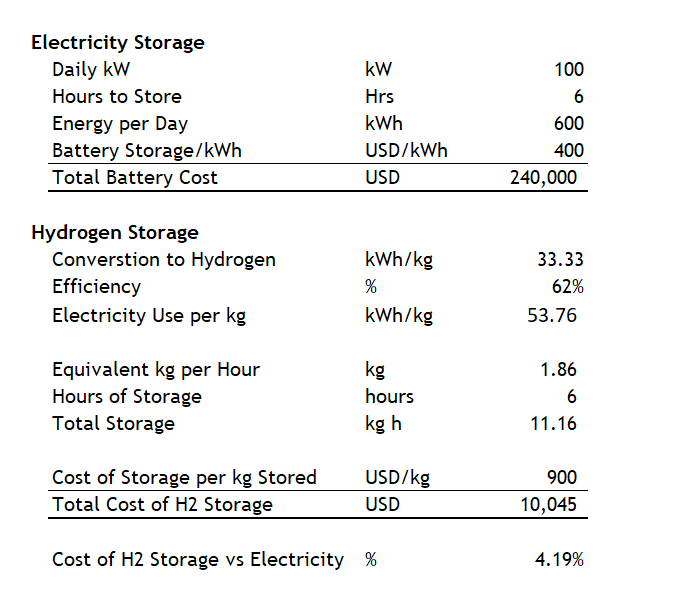
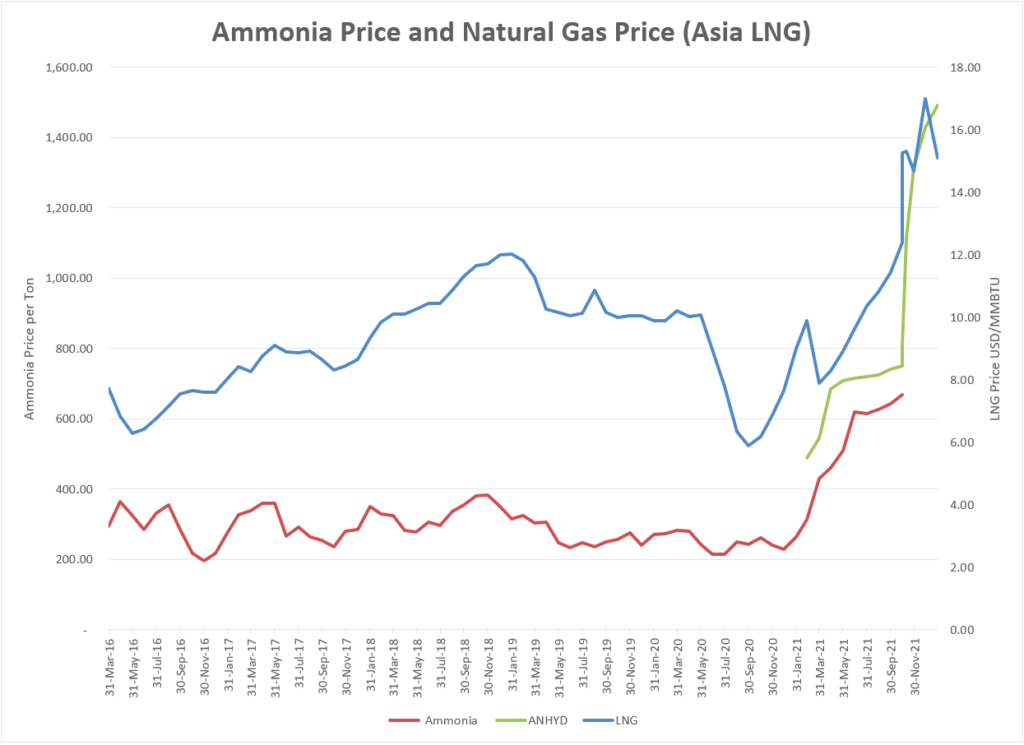
Sometimes it is so much more difficult to demonstrate things in simple terms than with large complex models. The problem is that you have to go through the complex models to finally arrive at the simple cases. Two examples below are the horrible BS I hear so much about how expensive hydrogen is to store. I may be more expensive than natural gas, but the comparison is not close when you compare to electricity storage with a battery. This is illustrated below.
This includes a analysis of each of the segments of cost from the renewable energy to the electrolyzer to storage and distribution to the cost of ownership of autos As with the first exercise, the first file is completed and the second exercise has equations that you should fill in.
.
.
.As with the first exercise, the button attached to the first file is the file with equations for you to fill in. The second button is attached to the file with the completed exercise.
.
.
.
.
.
.
.
The next two files demonstrate financial modelling and how the LCOE can be directly tied to a financial model (in the LCOE analysis you input the required return and in the financial model you input the price (LCOE). The models illustrate the importance of achieving a low cost of capital for renewable energy.
.
.
.
Working File for Levelised Cost of Electricity Analysis with Solar Data and LCOE Calculations
.
.